


E-Tech Resources Inc. Market Analysis Report Jan 2023
Initiating Market Analysis Report
E-Tech Resources Inc.
TSXV: REE | FSE: K2i
Sector/ Industry: Junior Mining | Rare Earth Elements
Author: Trevor Davis
E-Tech Resources (“E-Tech”, or “the Company”) is a Canadian-owned exploration-stage company in the rare earth element (“REE”) mining sector. The Company’s primary asset is the wholly-owned Eureka REE project in Namibia, a country in Southern Africa.
- E-Tech is focused on rare earth elements at Eureka:
- REEs are critical to the transition to clean energy
- Neodymium-Praseodymium (NdPr) oxide is the primary ingredient in the world’s most efficient and highest strength permanent magnets used in the renewable energy sector
- These magnets are used to generate electricity in wind turbines and electric vehicles
- Namibia is one of the best mining jurisdictions in Africa
- At Eureka, indications are that it will be easier to extract the NdPr due to the monazite nature of the deposit.
- Current stage of development:
- E-Tech is focused on exploration at this moment
- Eureka offers significant potential resource upside Indications are of a deposit that, the Company believes, shows the potential for streamlined, simple mining and treatment processes that could be advanced sooner than most
Proximity to highway, rail and port infrastructure provides access to external markets of both off-takers and downstream users of the mineral concentrate to be produced at Eureka. An experienced management team places E-Tech in a good position to be able to maximize the potential of the deposit.
E-Tech in its current form was created through a combination of E-Tech Kalapuse Mining (Pty) Ltd. (“E-Tech Namibia”) and Battery Road Capital Corp., with the combination closing in October 2021. E-Tech, and previously E-Tech Namibia, have been actively exploring the Eureka deposit since late 2016.
Key Advantages of E-Tech Resources
- Streamlined processes, offering the potential of simple operations
- Potential for an increase in minerals resources through continued exploration
- Accessible location, with close access to developed infrastructure
- Lowered geo-political risk profile, and focusing on a value chain outside of China
- A management team with in-country and mineral exploration experience
- Well positioned to take advantage of strong fundamentals in the rare earths sector
Risks
- The Eureka deposit, and E-Tech Resources, do present several potential risks, many of which are common for all exploration stage mining companies, especially in the rare earths sector.
- China may make an unforeseen policy change, which could impact supply and/or pricing of rare earths
- Rare earth oxide (“REO”) demand may vary from expectations
- Inflation may increase capital and/or operating costs
- Unforeseen challenges may arise in the processing of ore or concentrate from Eureka
- Changes in the size of the mineral resource at Eureka could vary from expectations
- Potential for permitting and regulatory challenges
- Financing will be required, at some point, to continue exploration and to fund development
- E-Tech management have an investment strategy outlined that intends to build value in 3 specific dimensions.
Exploration
Strategically grow and prove resource tonnage and grade through continued heavy drilling campaigns.
Near-term goals
- Relationships with pilot REE processing plants in several jurisdictions. This aligns E-Tech with investors, governments and institutions to create and expand REE processing outside of China.
- Access to emerging processing plants and projects in the form of off-take and supply agreements.
Long-term goals
- Large processing plant when more significant resource has been confirmed.
- Management believes the achievability of these goals are enhanced by the location in Namibia and the simple minerology, which means that the REEs can be extracted much easier at lower cost.
The Eureka deposit benefits from close-to-surface mineralization, allowing for targeted mechanized mining from open pits. The Company believes that what sets Eureka apart from its peers is the ease at which they expect the target REE mineral monazite can be liberated and concentrated. With REE mining, often the treatment of ore into concentrate (“beneficiation”) can be technologically complicated and expensive, but E-Tech have identified that beneficiation can be possible with low-cost physical methods using off-the-shelf equipment and without the need for hazardous chemistry and expensive reagents.
A simpler beneficiation operation (relative to many other deposits around the world) should allow Eureka to achieve pilot production capability in a shorter timeframe, and at a lower cost than many other exploration projects around the world. Simpler operations with less complicated beneficiation processes can be expected to increase the economic potential of the deposit and reduce time to production.
What sets Eureka apart from its peers is the ease at which they expect the target REE mineral monazite can be liberated and concentrated
Eureka has a maiden inferred resource, generated from 600m of shallow scout drilling conducted in 2017 at a total rare earth oxide (“TREO”) grade of 4.8%, of which 0.7% is high-in-demand NdPr.
Between Q4-2020 and Q2-2022, E-Tech stepped up drilling meters significantly by completing a further 8,000m of diamond core drilling and 6,000m of RC drilling at the Eureka Project (more than 20x the amount of drilling on which the current resource estimate is based).
Early results from the drilling, as disclosed by the Company, has intercepted continuity of the mineralization, and 30 of the 31 diamond core drill holes were mineralized. While the ultimate resource size, grade, and confirmation of the type of mineralization will not be known until an updated resource estimate is published, these results show positive trends and the Company is confident that the ultimate resource will be larger than the current resource estimate.
E-tech is currently completing additional drilling of the deposit and plans to release an updated mineral resource estimate (“MRE”) once the drilling program and analysis is complete.
Low thorium and uranium content at Eureka, a considerable risk for other REE projects, reduces permitting, processing and infrastructure challenges. This makes the REE mineral concentrate from Eureka more attractive to global customers.
Results from this drilling and continued wider exploration is expected to increase the size of the resource and could provide significant upside to the Company.
Early results from the drilling, as disclosed by the Company, has intercepted continuity of the mineralization, and 30 of the 31 diamond core drill holes were mineralized.
When E-Tech continues their exploration programs, focus will be on the following metrics:
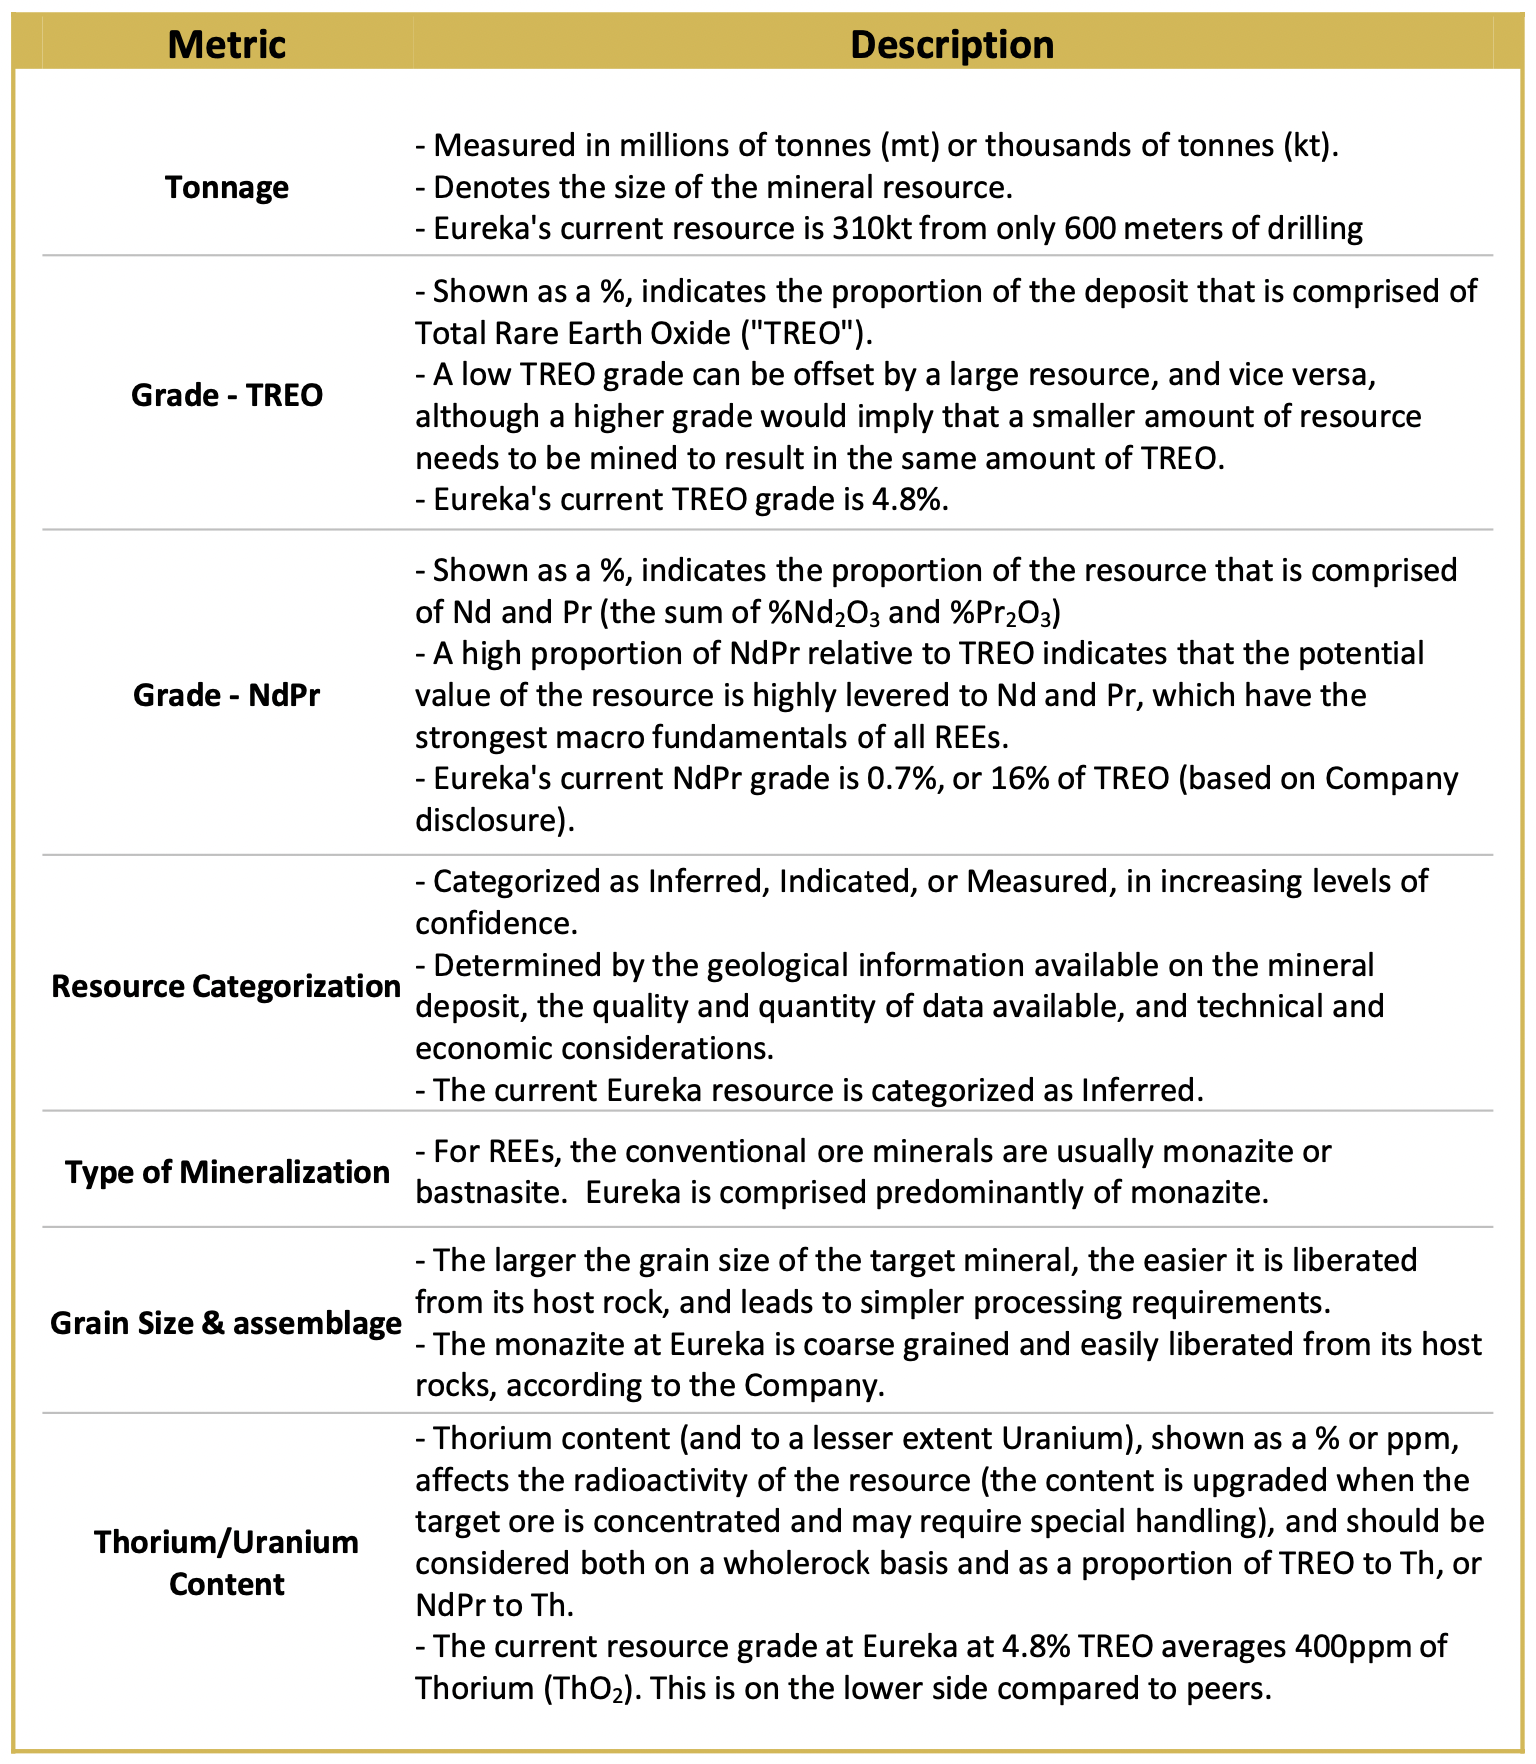
Figure 1 – Source: Company disclosure
TREO grade of 4.8%
Current NdPr grade is 16% of TREO
Inferred resource Predominantly coarse-grained monazite
Low Thorium content
Lower Geopolitical Risk Profile
China continues to dominate the REE industry at every step of the value chain. Due to China’s inherent geopolitical risk, both Western governments and end users are looking to de-risk their REE supply by developing a supply chain outside of China.
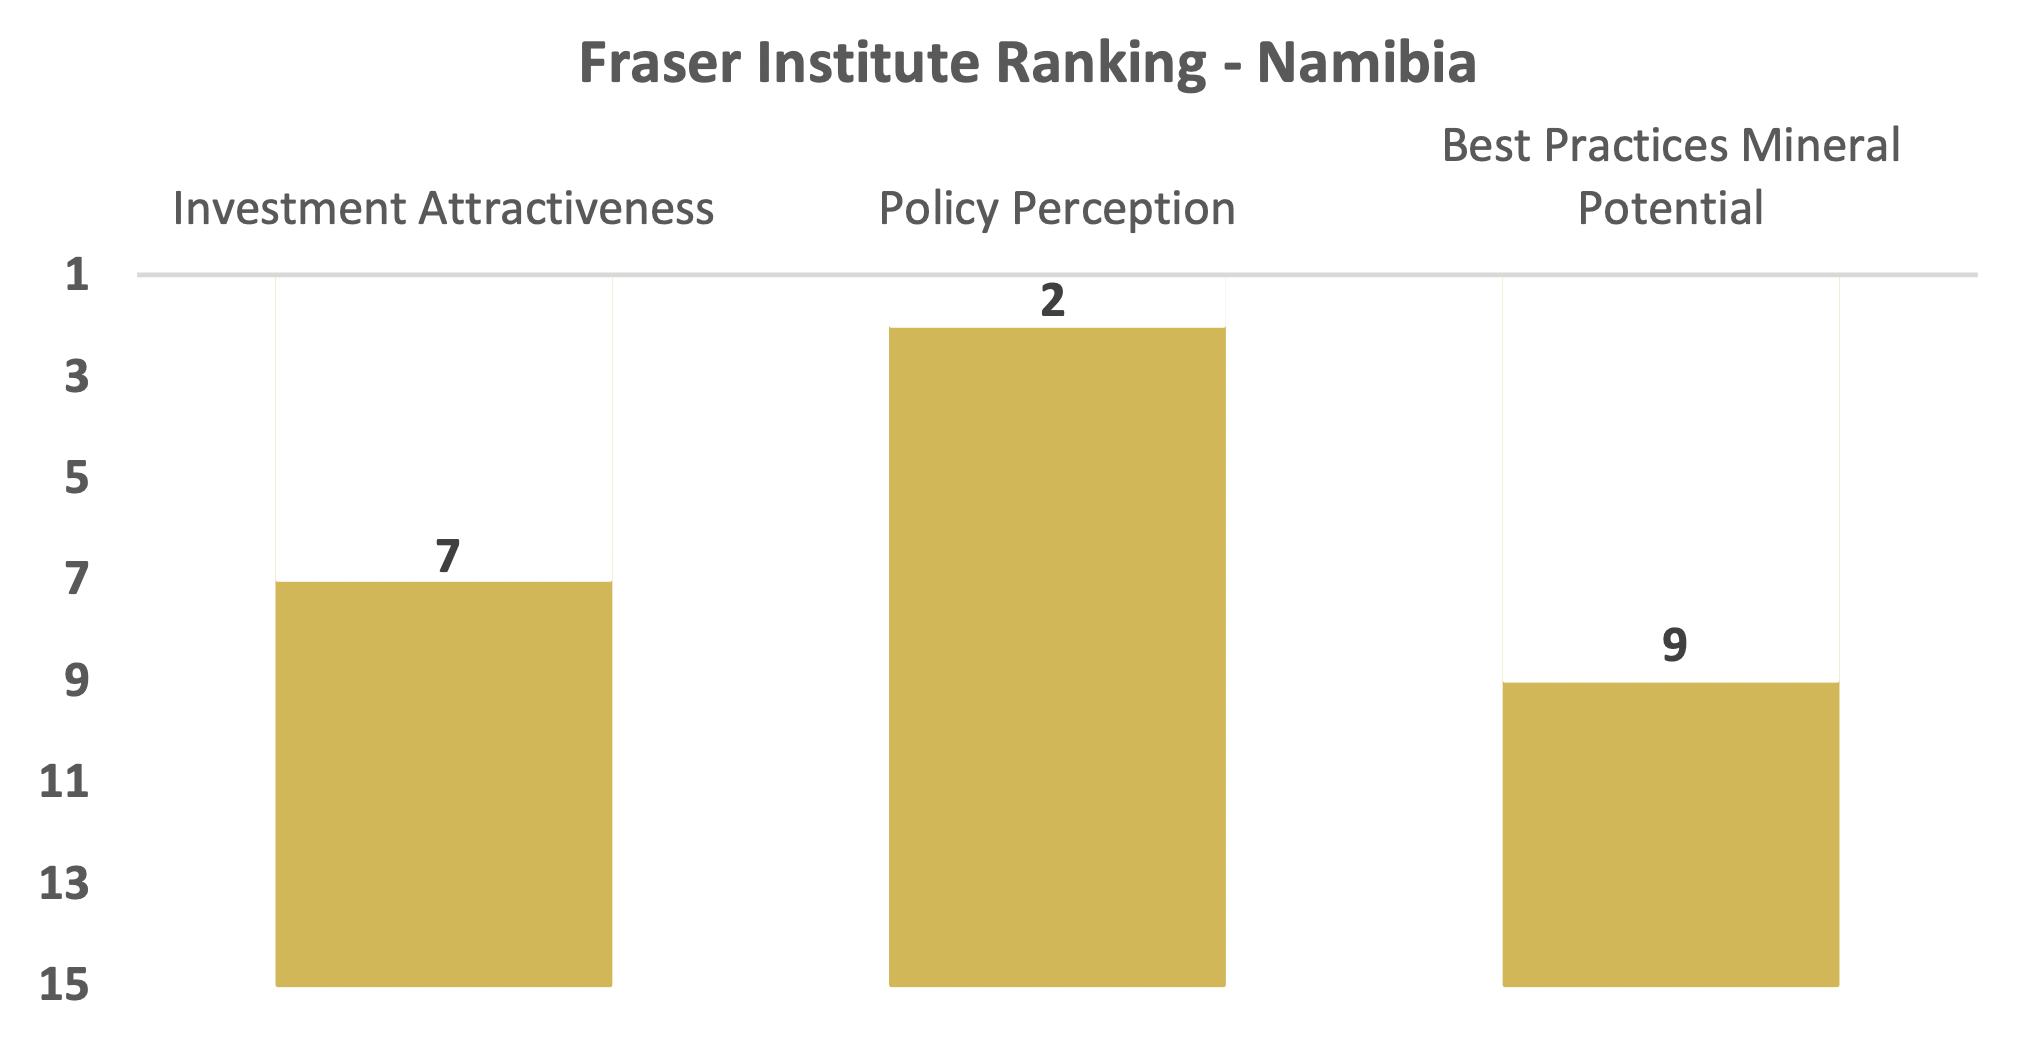
E-Tech’s Eureka deposit is located in Namibia, which is one of the best-rated mining jurisdictions in Africa according to the Fraser Institute. Namibian regulators and stakeholders are also accustomed to mining operations where radioactivity is naturally occurring , due to the history of uranium mining in the region, and therefore, the region is well positioned for managing the regulatory requirements associated with REE mining.
E-Tech provides an opportunity to reduce reliance on China and provide potential customers a lower-risk source of supply, facilitated by a partnership with the Saskatchewan Research Council. The goal of the partnership is to develop a process for cracking and separation of the REE mineral concentrate to be exported from Eureka.
Located in Namibia, which is one of the best- rated mining jurisdictions in Africa according to the Fraser Institute
Partnership with Saskatchewan Research Council to develop a process for cracking and separation of the REE mineral concentrate
Management Team with In-Country Experience
The key management team, including interim CEO Jim Megann, CFO Rob Randall, and Director Christopher Drysdale all have relevant professional experience, including experience in- country and with REE exploration.
Strong Industry Fundamentals for Rare Earths
While not all REEs enjoy the same supply/demand fundamentals and pricing outlook, Neodymium and Praseodymium, Dysprosium (“Dy”), and Terbium (“Tb”) are in short supply and are expected to remain so in the near future. Demand for these elements is driven by continued expected growth in electric vehicles, where they are key components of electric motors, and in wind turbines.
As more and more countries are committing to increasingly aggressive environmental and low-emissions targets, we expect demand for electric vehicles and wind turbines to grow significantly. With low substitution risk for key rare earth elements, this demand should drive a continued supply/demand imbalance, and support prices, for NdPr. Rare earth mines, and projects that contain economically viable quantities of these elements, should benefit.
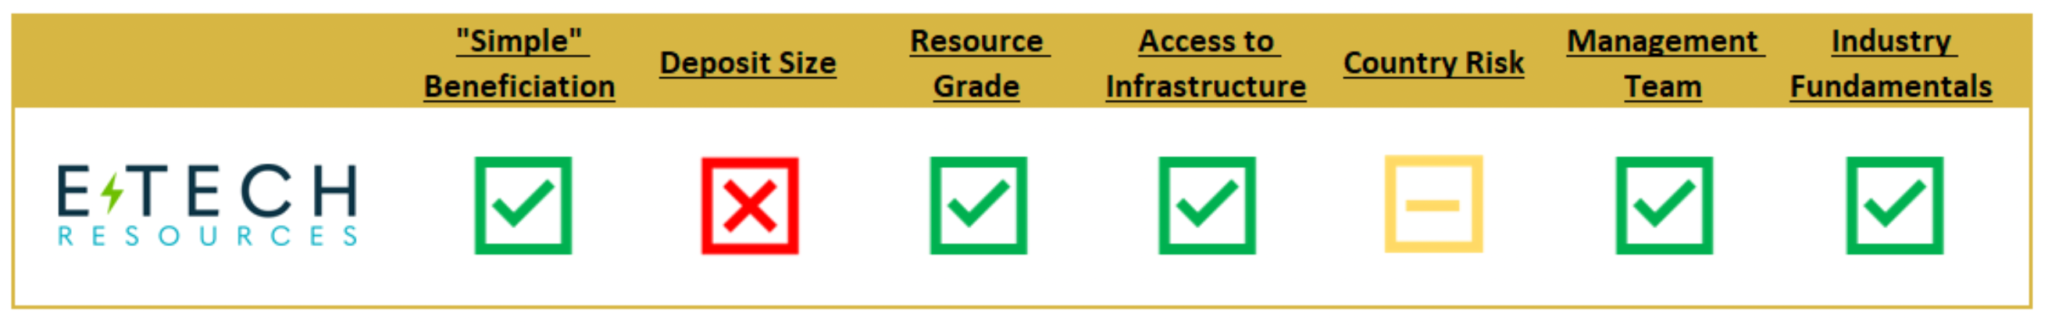
Figure 2 – Source: Company presentations and disclosure
Neodymium and Praseodymium, Dysprosium (“Dy”), and Terbium (“Tb”) are in short supply and are expected to remain so in the near future.
Key Milestones and Catalysts
The next key milestone for E-Tech and the Eureka deposit will be:
- Expanding the footprint of the mineralized area and continuing to advance understanding of the mineralogy
- Determining interested parties for offtake
- Expand the measured ore body size with a view to increasing the MRE
- Further focus on ESG best principles in engagement with the local community and enabling the drive to renewable technologies
Company-specific catalysts that could drive value in E-Tech will include:
- Confirming more high-grade Neodymium and Praseodymium Concentrate
- Eureka is a globally unique REE deposit due to the high proportion of neodymium and praseodymium in the total rare earth oxide (NdPr ratio).
- Additional Positive Metallurgy Results
- Eureka is predominantly hosted in monazite which is amenable to commercial processing.
- Global demand increases from ex-China sources
- Supply chain security and low carbon transition are imperatives against a backdrop of heightened geopolitical tension pushing supply away from China.
Milestones:
• Expanding mineralized area
• Offtake interest
• Increase MRE
• ESG
Catalysts:
• Highgrade NdPr
• Positive metallurgy
• Demand lift
Company Analysis
E-Tech is an exploration-stage company in the rare earths mining sector. The Company’s primary asset is the wholly-owned Eureka REE project in Namibia, which has considerable potential to become a major source of key REEs.
History
E-Tech Resources Inc (TSX.V:REE, FSE: K2i) was created in October 2020 with the announcement of a share exchange agreement between E-Tech Kalapuse Mining (Pty) Ltd. (“E-Tech Namibia”) and Battery Road Capital Corp. (“Battery Road”), a Capital Pool Company. The transaction was completed in October 2021, and the combined entity was renamed E-Tech Resources Inc.
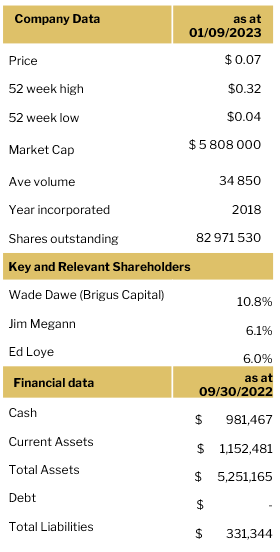
The largest shareholders of Battery Road were Brigus Capital Inc. (a company controlled by Wade Dawe) and Jim Megann.
Key executives and directors of Battery Road included Jim Megann (now Chairman & interim CEO of E-Tech), Dan Whittaker (former CEO of E-Tech), Carl Sheppard, and Garry Stewart.
Location of Eureka
1. Source: BDO Namibia, https://www.bdo.com.na/en-gb/industries/natural- resources/mining-in-namibia
Mining operations and handling of mining products that contain radioactivity is well understood in Namibia.
Figure 3 – Source: Fraser Institute Annual Survey of Mining Companies 2021
Namibia ranks particularly high in the Policy Perception index (PPI), which reflects the attractiveness of mining policies in a jurisdiction. Namibia is also one of only three African jurisdictions in the survey that increased their PPI score from 2020 to 2021.
It is interesting to note that, in Investment Attractiveness index, Namibia ranks higher than many other well known (or even better known) mining jurisdictions, such as Turkey, Mongolia, Bolivia, Chubut and Mendoza, Argentina, South Africa, the Democratic Republic of Congo, and even Spain.
However, overall, according to the survey, Africa generally is the second least attractive region of mining investment.2
Using the same list of African mining jurisdictions highlighted in the Fraser Institute survey, but cross-referenced with the World Bank ranking of “Ease of Doing Business”, Namibia ranks 4th (although 104th overall, out of 190 ranked countries).3
Other mining operators in Namibia include Canadian companies B2Gold, Dundee Precious Metals, Forsys Metals, among others.
Within Namibia, mining accounted for 9.1% of 2021 GDP, making it the largest contributor4, and indicating the mining sector’s importance to the national economy.
2. Source: Yuni, Jairo & Aliakbari, Elmira. “Fraser Institute Annual Survey of Mining Companies 2021” Fraser Institute
3. Source: World Bank,”Ease of Doing Business Rank”, https://data.worldbank.org/indicator/IC.BUS.EASE.XQ
4. Source: “Namibia: Attractiveness As Mining Jurisdiction Slammed”, AllAfrica.com, April 29, 2022
The Eureka Deposit
E-Tech, and previously E-Tech Namibia, have been exploring the Eureka deposit area, within Exclusive Prospecting License (“EPL”) 6762, since late 2016. The licensed area encompasses 3,474 ha.
The Eureka deposit is located in the Erongo Region of Namibia, 250km by road from the capital Windhoek. The region is close to major transport and shipping infrastructure, including 2km from the Trans-Kalahari highway, 10km to a railway, and 130km from the recently expanded Walvis Bay container port. The site has access to power and water. Access to infrastructure is a considerable advantage of the Eureka deposit, compared to many exploration opportunities that are in more remote regions.
A ground magnetic and radiometric survey was completed in Q4-2016, identifying drill targets. Drilling commenced in Q1- 2017, along with a gravity orientation study, trenching, reconnaissance mapping, and an aerial topographic imagery survey to identify further exploration targets. After initial drilling in 2017, further drilling has been completed in 2020, 2021, and 2022.
The Company has stated that the project is fully permitted and enjoys strong local and governmental support.
Drilling commenced in Q1-2017 and further drilling has been completed in 2020, 2021, and 2022
The Eureka Deposit location
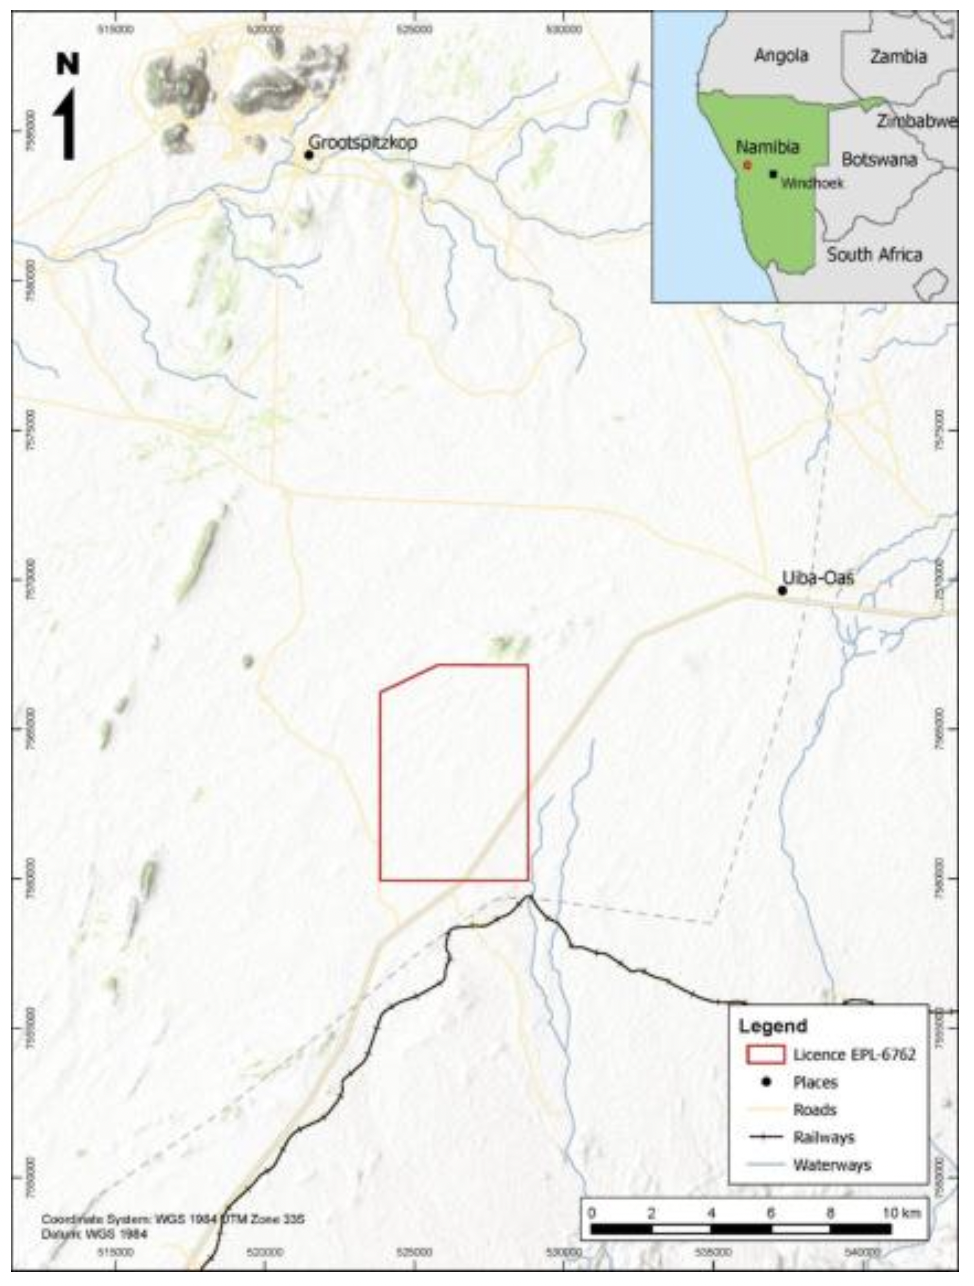
Figure 4 – Source: Eureka 43-101
Resource Estimate
Based on the August 2021 43-101 report issued by the Company, the Eureka deposit includes the following resource estimate:
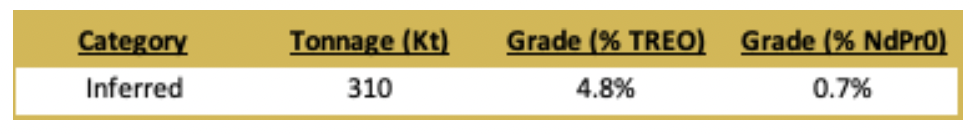
Figure 5 – Source: Eureka 43-101. % NdPr0 is the sum of %Nd2O3 and %Pr2O3
According to the technical report, prepared by SRK Consulting (UK) (“SRK”), there is “significant potential to increase the size of the Mineral Resource with further exploration.”
As explained previously, although NdPr only comprises 16% of the REE basket at Eureka, NdPr actually comprises almost 80% of the REE basket by value, based on the current resource.
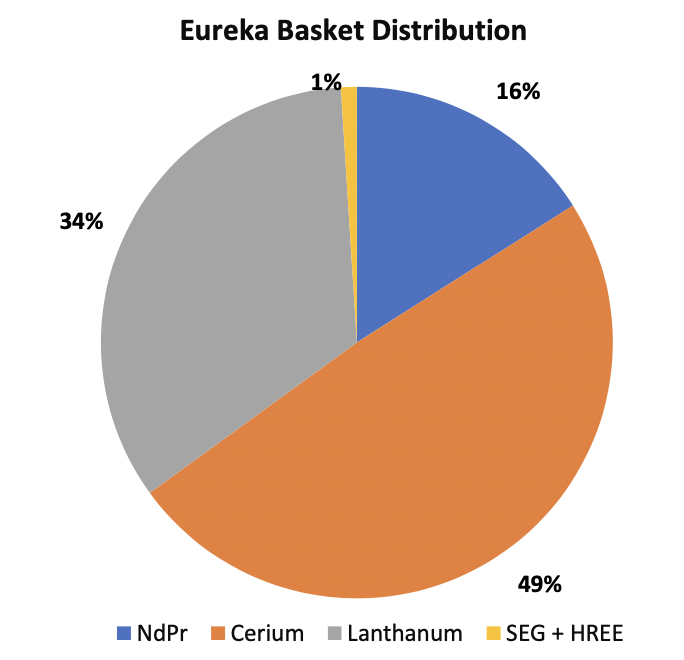
Figure 6 – Source: Company presentation
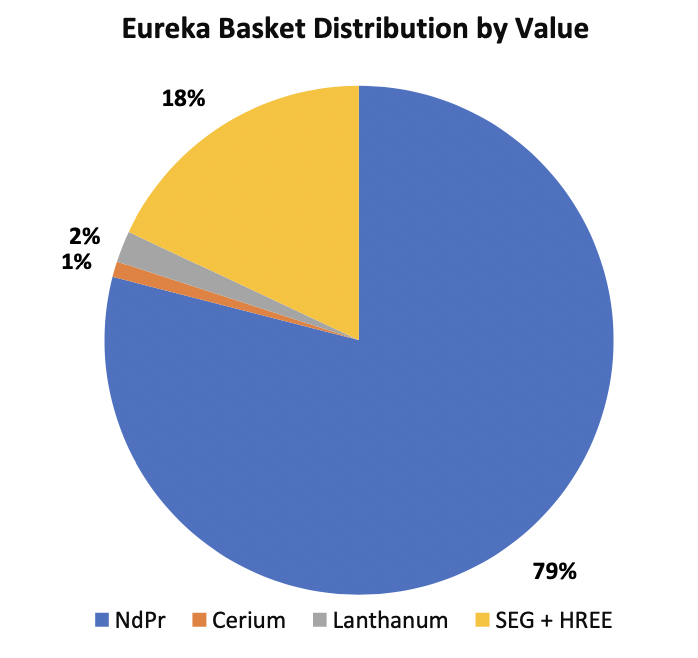
Figure 7 – Source: Company presentation
Technical report by SRK states there is “significant potential to increase the size of the Mineral Resource with further exploration.”
Exploration Activities
E-Tech is actively exploring Zones 1 – 4, as detailed in the map below. Red collars indicated historic drilling that contributed to the current mineral resource estimate.
Between Q4-2020 and Q2-2022, the Company completed 8,000m of diamond core drilling and 6,000m of reverse circulation drilling, across 2 campaigns. This is compared to 600m of shallow scout drilling conducted in 2017, on which the current resource estimate is based.
These additional drill holes are shown as Campaign 1 and Campaign 2 below. Early results from the drilling, as disclosed by the Company, has intercepted continuity of the mineralization, and 30 of the 31 diamond core drill holes were mineralized. The results of these drilling campaigns will be used, along with further assay results, modelling and associated exploration activities, to provide an updated mineral resource estimate. The Company has stated that the deposit is open in all directions and to depth.
Company completed 8,000m of
diamond core drilling and 6,000m of reverse circulation drilling
Intercepted continuity of the mineralization, and 30 of the 31 diamond core drill holes were mineralized
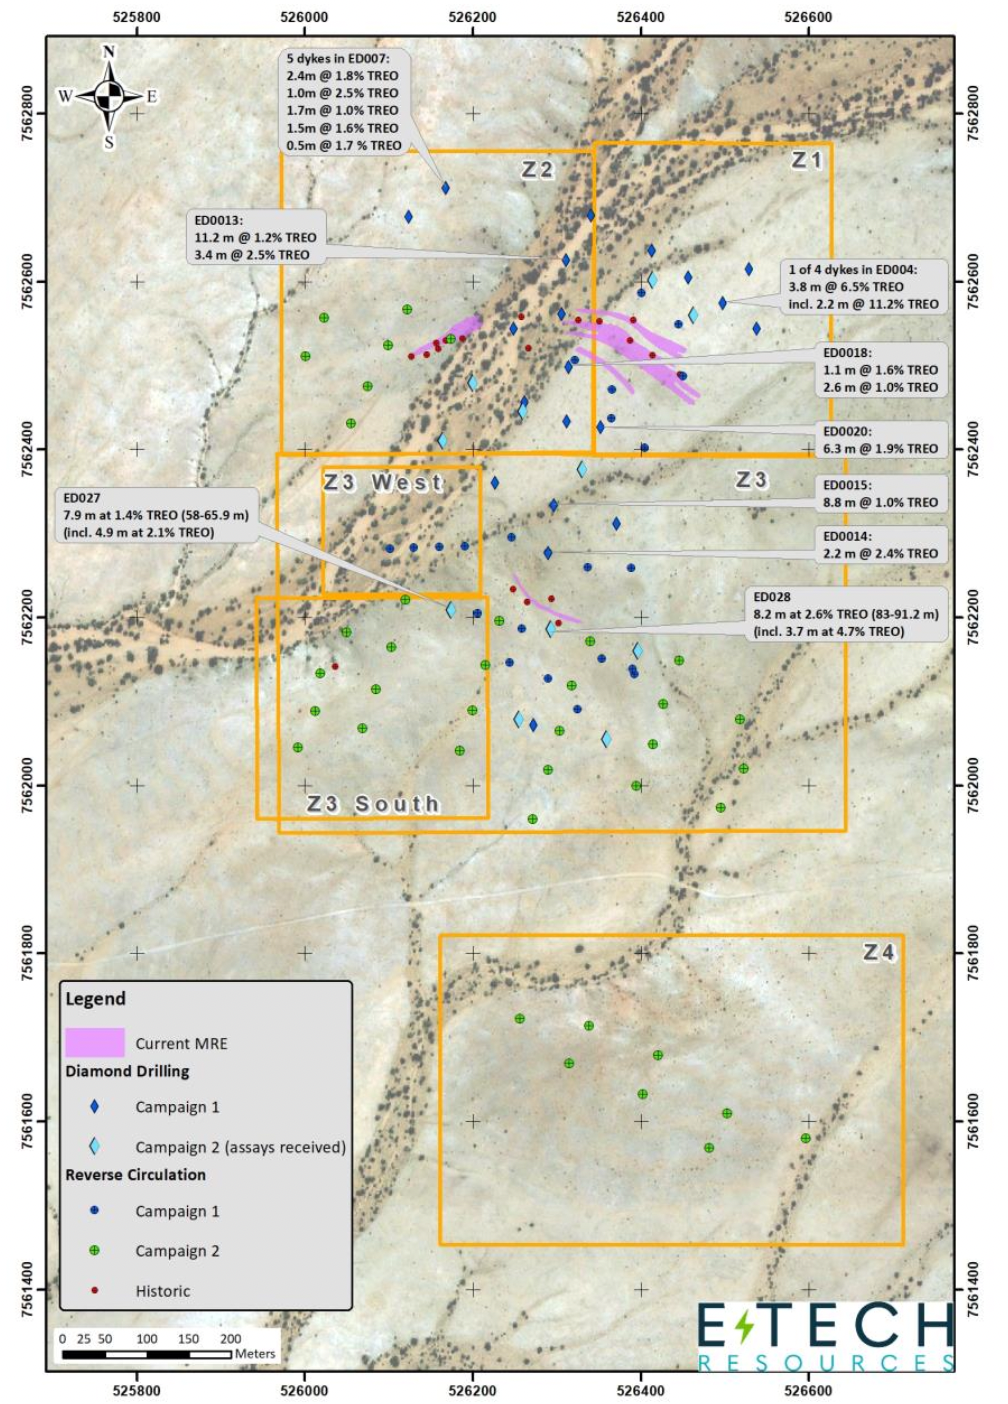
Figure 8 – Source: Company disclosure
The Company indicated in a press release on November 16, 2022 that an initial seventeen (17) drill target areas have been identified following the ground radiometric and magnetic geophysical surveys, and geological mapping program.
These 17 target areas can be seen on the below map as the shapes with white borders.
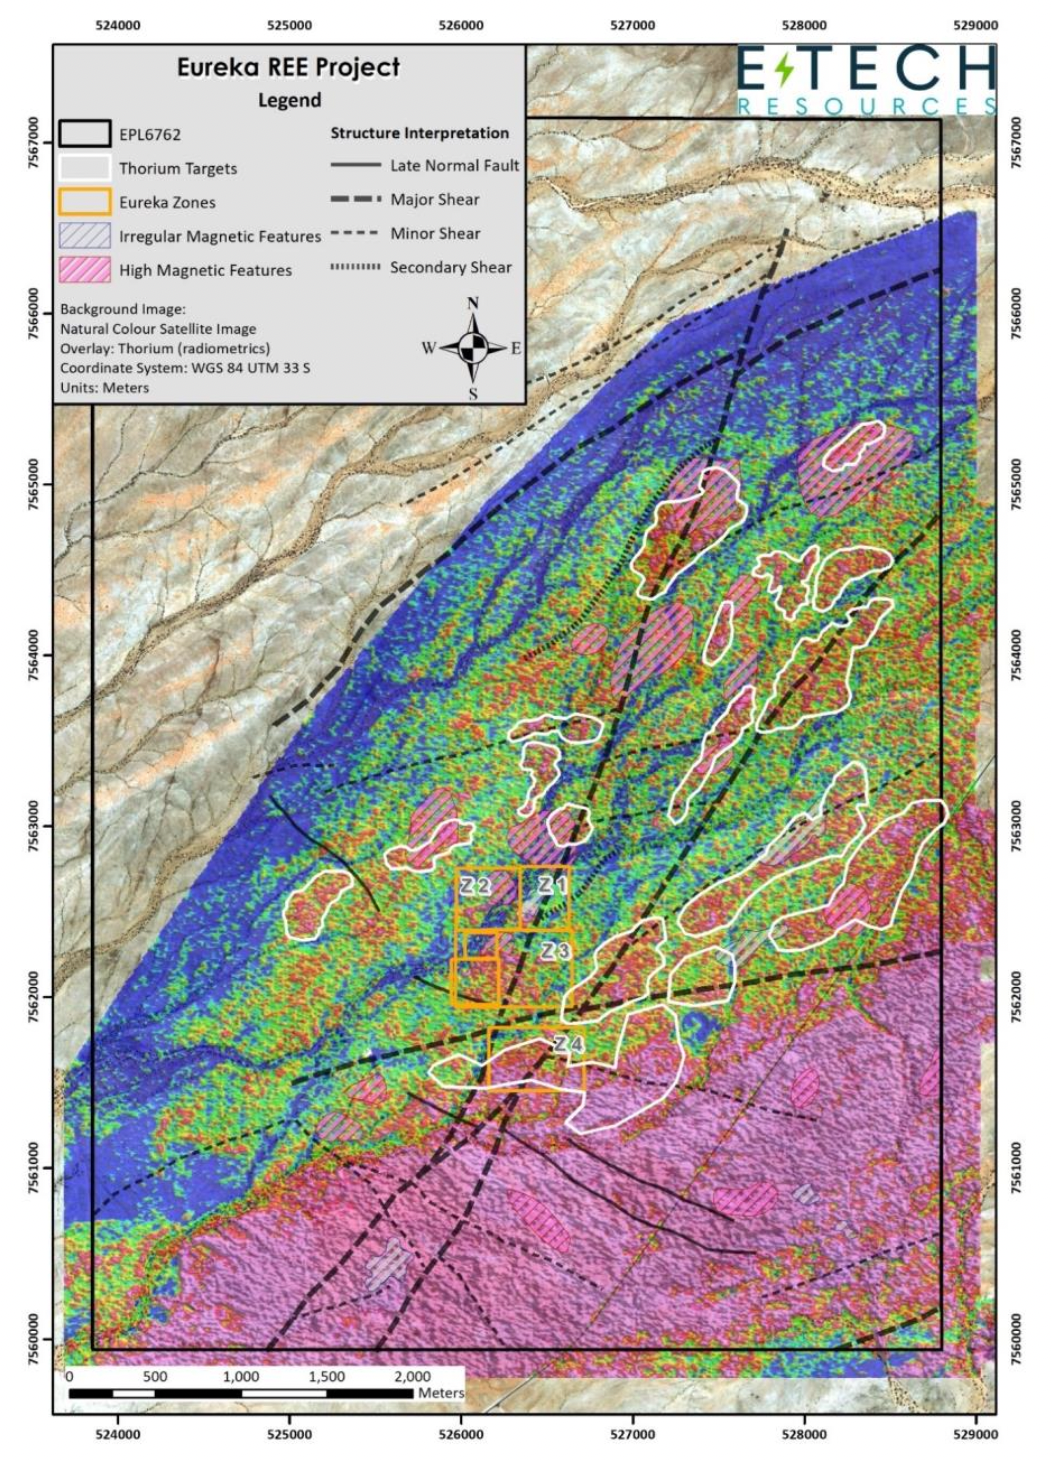
Figure 9: Exploration targets (white outlines) across EPL-6762 defined by anomalous thorium and supported by favorable lithologies and structural features.
Rare Earth Value Chain
The rare earth value chain is depicted below. Most REE mining companies produce rare earth mineral concentrates, which must be further refined through cracking, separation and purification processes to produce grouped or individual rare earth oxides. Some mining companies intend to develop their own separation capabilities, while others intend to send REE mineral, or cracked intermediate, concentrates to third-party facilities for separation and further processing.
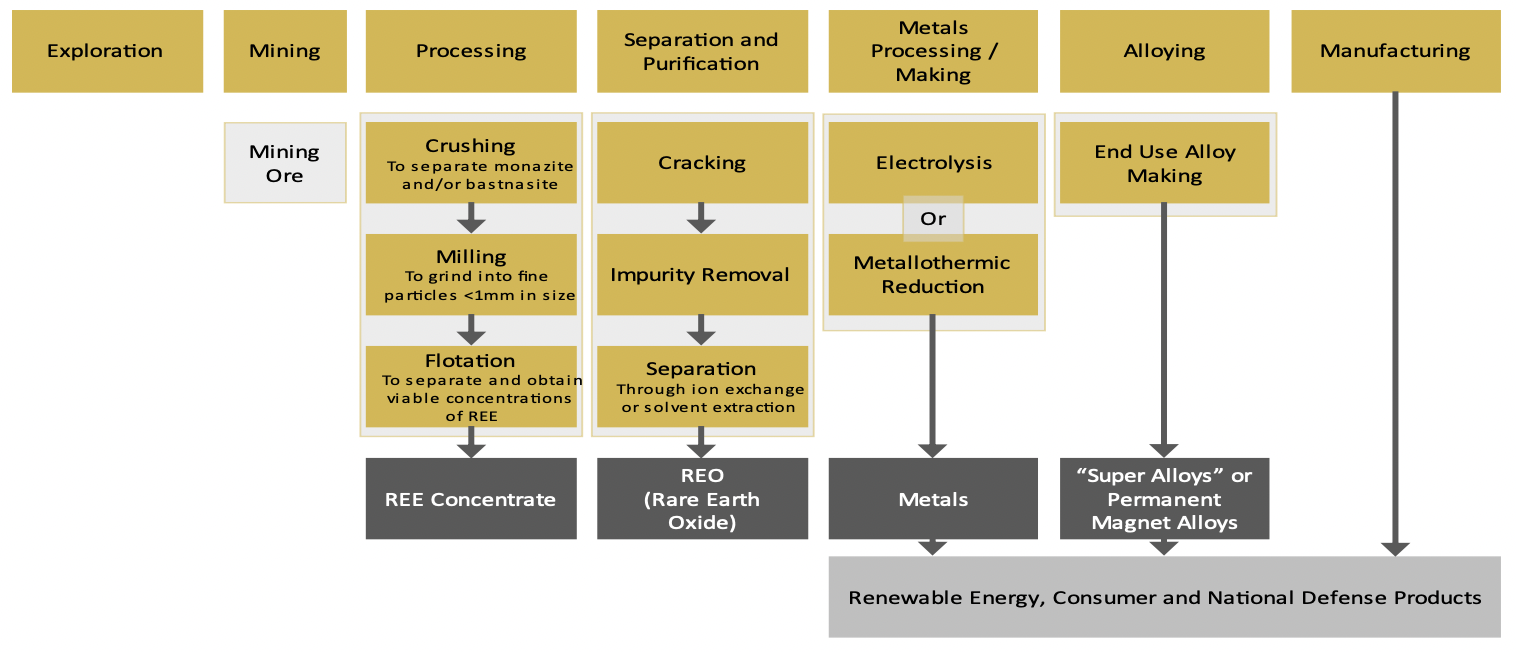
Figure 10 – Source: Recreated from Energy.gov with input from the Company
Other Considerations
Separation Challenges
5. Source: Feng Xie, et al., “A critical review on solvent extraction of rare earths from aqueous solutions”, ScienceDirect.com, February 2014
Substitution Risk
Substitution risk of REEs in the value chain is a concern. Concerns about supply of NdPr for permanent magnets, for example, may encourage end users to reduce their use of these types of magnets or find substitutes. However, the benefits of NdPr permanent magnets over other types of magnets, and the small cost compared to the total cost of the finished products (i.e., an electric vehicle), reduces potential substitution risk.
Radioactivity
Most REE ores naturally contain uranium and/or thorium, which are radioactive elements. This can have a significant impact on processing of the ore and transportation of mineral concentrates, as well as disposing of waste streams. Levels of radioactive elements and resulting potential radiation from handling and transporting ore or concentrate, will have a significant impact on whether a particular mineral deposit or project can be economically viable.
When evaluating a REE deposit, the relative concentrations of TREO, NdPr, and radioactive elements, such as thorium, is critical and should not be overlooked.
The following table highlights radioactivity levels (measured in becquerel / gram), of the Eureka deposit monazite compared to REE ore minerals of several other similar deposits. Eureka shows very favourably in this comparison.
Eureka shows up very favourably in the comparison of radioactivity levels.
Volume
Current resource estimates of the Eureka project estimate a 16% NdPr proportion of the total REE basket, by volume, but represent 79% of the basket value. NdPr prices are therefore a key driver to the Eureka project (and therefore E-Tech).
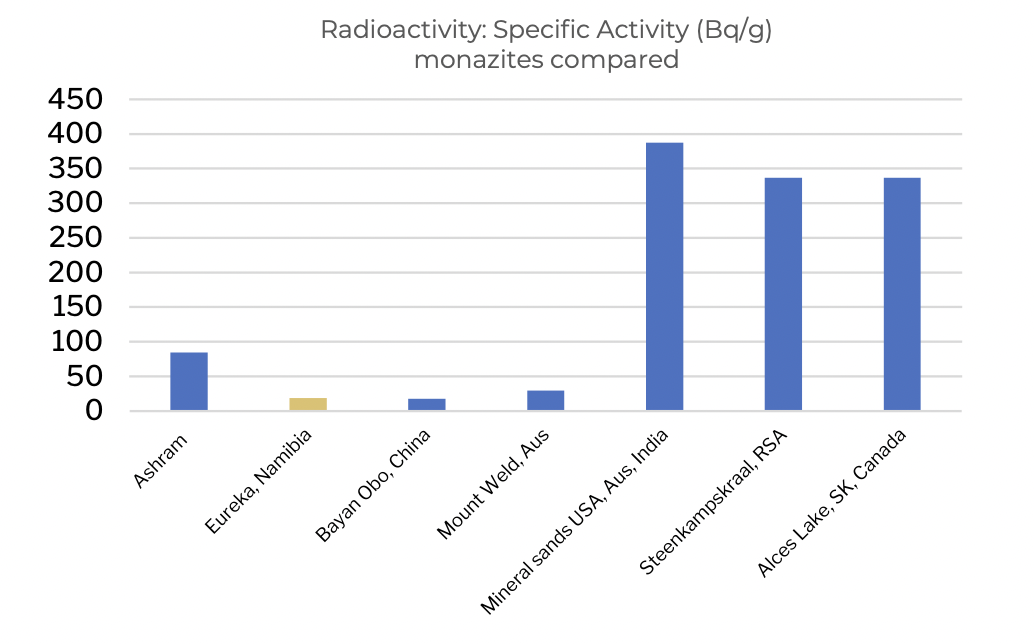
Figure 11 – Source: Company presentation
Eureka shows up very favourably in the comparison of radioactivity levels.
Processing Plans
One of the key highlights of the Eureka deposit, as described by the Company, is the (relatively) simple processing requirements due to the coarse grained nature of the REE mineral monazite and its subsequent ease of liberation from the host rock. Mining will be targeted using open pit mining techniques. Beneficiation is expected to be possible with low-cost physical methods, not requiring hazardous chemicals or a complicated beneficiation plant. The monazite in the host rock will go through gravitational concentration and magnetic separation to result in a monazite concentrate.

Figure 12 – Source: Company presentation
Simple processing requirements due to the coarse grained nature of the REE mineral monazite
Due to the low expected radioactivity levels of the ore at Eureka, there are minimal shipping constraints and mineral concentrate produced from Eureka should be able to be shipped most places in the world on regular cargo ships. This provides many options to the Company when arranging agreements for downstream processing.
Once the concentrate has been received by an off-taker, it is first chemically “cracked” into a mixed REE compound that then must be further separated into individual oxides by solvent extraction. The oxides are further processed into metals for alloying, or into compounds, depending on the manufacturer’s specifications.
As discussed previously, most of the expertise and capacity for this further processing is located in China, introducing significant geo-political risks to the typical supply chain. In an attempt to circumvent this issue and provide downstream users with a source of supply external to China, E-Tech has signed a non- binding LOI with the Saskatchewan Research Council (“SRC”) to cooperate in the test work and pilot scale processing of mineral concentrate from the Eureka deposit. This partnership with SRC is a key differentiator of E-Tech compared to other exploration stage REE companies.
The potential of conducting the intermediate-step processing (or “cracking”) of the Eureka mineral concentrate in Namibia has yet to be assessed by the Company.
This partnership with SRC is a key differentiator of E-Tech compared to other exploration stage REE companies.
Management Team
The management team has extensive exploration and development experience, including in-country through their involvement with Antler Gold Inc., a gold exploration company focused on the Erongo Gold Project in Namibia.
Chairman & Interim CEO – Jim Megann
Jim took over the roles of Chairman & CEO from Dan Whittaker in September 2022. Jim has over 25 years of experience in the communications and marketing industry, and is a Principal and Managing Director at Numus Financial, as well as a Director for Torrent Capital (TSX.V: TORR), OARO, and Sona Nanotech (TSX.V: SONA).
Management team has extensive exploration and development experience in- country
CFO – Rob Randall
Rob Randall has a range of experience as a contract CFO for various TSX.V listed companies, including Torrent Capital, Sona Nanotech, and Antler Gold. He has also previously worked as Controller of Etruscan Resources Inc. and Nova Gold Resources Inc.
VP Operations & Director – Christopher Drysdale
Chris Drysdale has extensive experience in the mineral and exploration industry throughout Africa, and as at 1 November 2022 was the VP, Operations and Corporate Development for Antler Gold Inc.
Other directors also have direct or indirect relationships with Torrent Capital, Sona Nanotech, and/or Antler Gold.
Financial Situation
E-Tech has $0.9 million cash (as at September 30, 2022) and no debt on their balance sheet, but, as with all exploration companies, will have to raise additional capital to fund some of their exploration plans and eventual capital required to develop the mine. Specific spending plans and budgets have not been publicly released by the company.
Comparative Analysis
Select company comparables include:
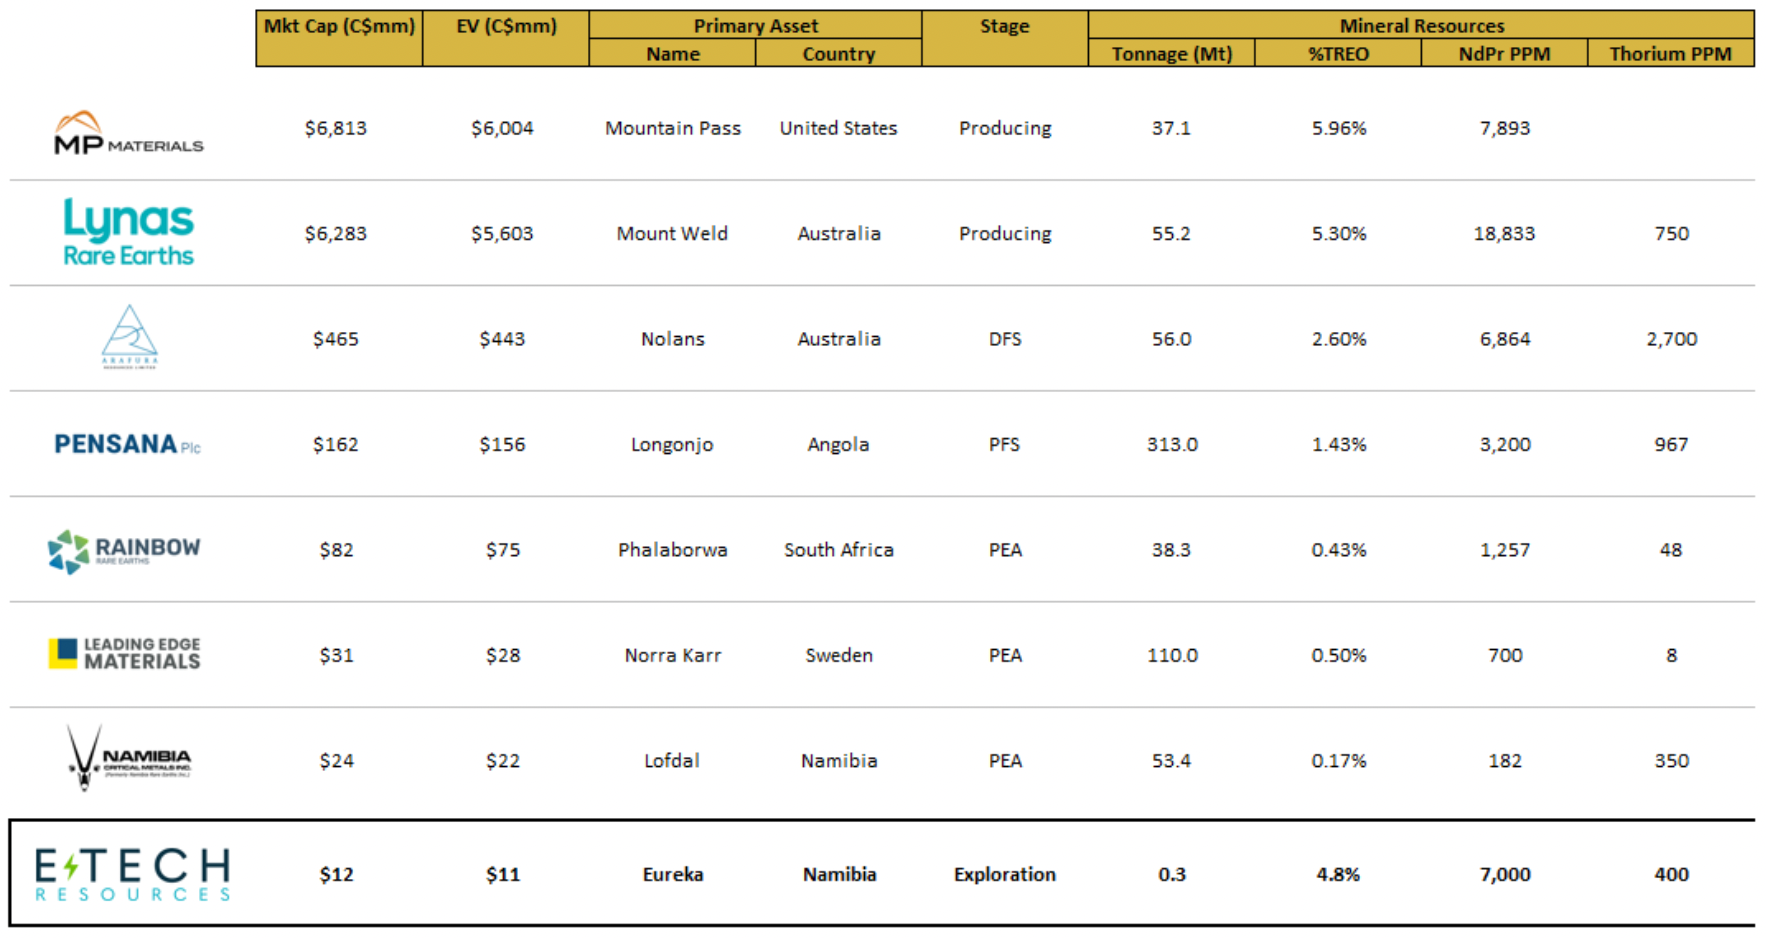
Figure 13 – Source:Company disclosure and various industry sources. Mineral resources includes both Proven & cProbable Reserves as well as Measured, Indicated & Inferred Resources, as appropriate. All resources are shown on a 100% basis.
Simple processing requirements due to the coarse grained nature of the REE mineral monazite
E-Tech compares very favorably to peers in the sector, in terms of TREO grade and the proportion of TREO that is composed of NdPr. Critically, the ratio of NdPr to Thorium in the resource compares very favorably to several other projects, implying lower radioactivity in the resulting concentrate and fewer issues related to radioactivity. Future resource updates will provide important guidance on the size of the potential resource at Eureka.
E-Tech compares very favorably to peers in the sector, in terms of TREO grade and the proportion of TREO that is composed of NdPr
Risks and Challenges
The Eureka deposit, and E-Tech Resources, face several challenges, most of which are common for exploration-stage mining companies and/or companies in the rare earths sector.
- China may make an unforeseen policy change, which could impact supply and/or pricing of rare earths
- Rare earth oxide (“REO”) demand may vary from expectations
- Inflation may increase capital and/or operating costs
- Unforeseen challenges may arise in the processing of ore or concentrate from Eureka
- Changes in the size of the mineral resource at Eureka could vary from expectations
- Potential for permitting and regulatory challenges
- Financing will be required, at some point, to continue exploration and to fund development
Disclaimer and Disclosure
This report is provided to you for informational purposes only. The results stated herein are Numus Financial’s own conclusions. Investors should consider this report as only a single factor in making their investment decision. Numus Financial and Numus Capital have and may from time to time own shares in the company mentioned in this report. Nothing contained in this report is, or should be, relied upon as a promise or representation as to the future performance. The estimated financial information contained in this report, if any, is based on certain assumptions and the analysis of information available at the time that this information was prepared. There is no representation, warranty or other assurance that any projections contained in this report will be realized.
This report is not intended to provide personal investment advice. Investors should seek advice regarding the suitability of any investments or strategies discussed in this report. Opinions, estimates and projections are those of Numus Financial Inc and are subject to change without notice. Individuals involved in the production of research materials operate are employed permanently or on a freelance basis by Numus Financial Inc.
This report is not and is not to be construed as (i) an offer to sell or solicitation of an offer to buy securities or (ii) an offer to transact business in any jurisdiction or (iii) investment advice to any party. Products and services described herein are only available where they can be lawfully provided.
The author received $12,818.00 in cash for drafting the report from Numus Financial. This compensation is the only extent of any personal, professional, or financial relationship the author, their firm or its parent, subsidiaries, agents, or trading entities may have with the subject company, its personnel, parent, subsidiaries, or agents. The author has BESc Mechanical Engineering and MBA degrees that qualify them to produce the report. The author will provide continuing coverage at the request of Numus Financial Inc.
Relationship Between E-Tech Resources Inc. and Numus Financial Inc.
Numus Financial, Inc.(“Numus”) is a venture capital firm based in Canada. Various, publicly disclosed relationships exist between E-Tech, Numus, and various shareholders, officers and directors of each company.
The recently announced Chairman and interim CEO of E-Tech, Jim Megann, is also a Principal and Managing Director of Numus Financial.
Numus has also arranged various loans for E-Tech, acted as an agent to E-Tech’s brokered private placement financing, and is currently engaged by E-Tech through a Services Agreement and a Digital Marketing and Awareness Agreement.
PRIMER ON THE RARE EARTH INDUSTRY
The Rare Earths Industry
What are Rare Earths?
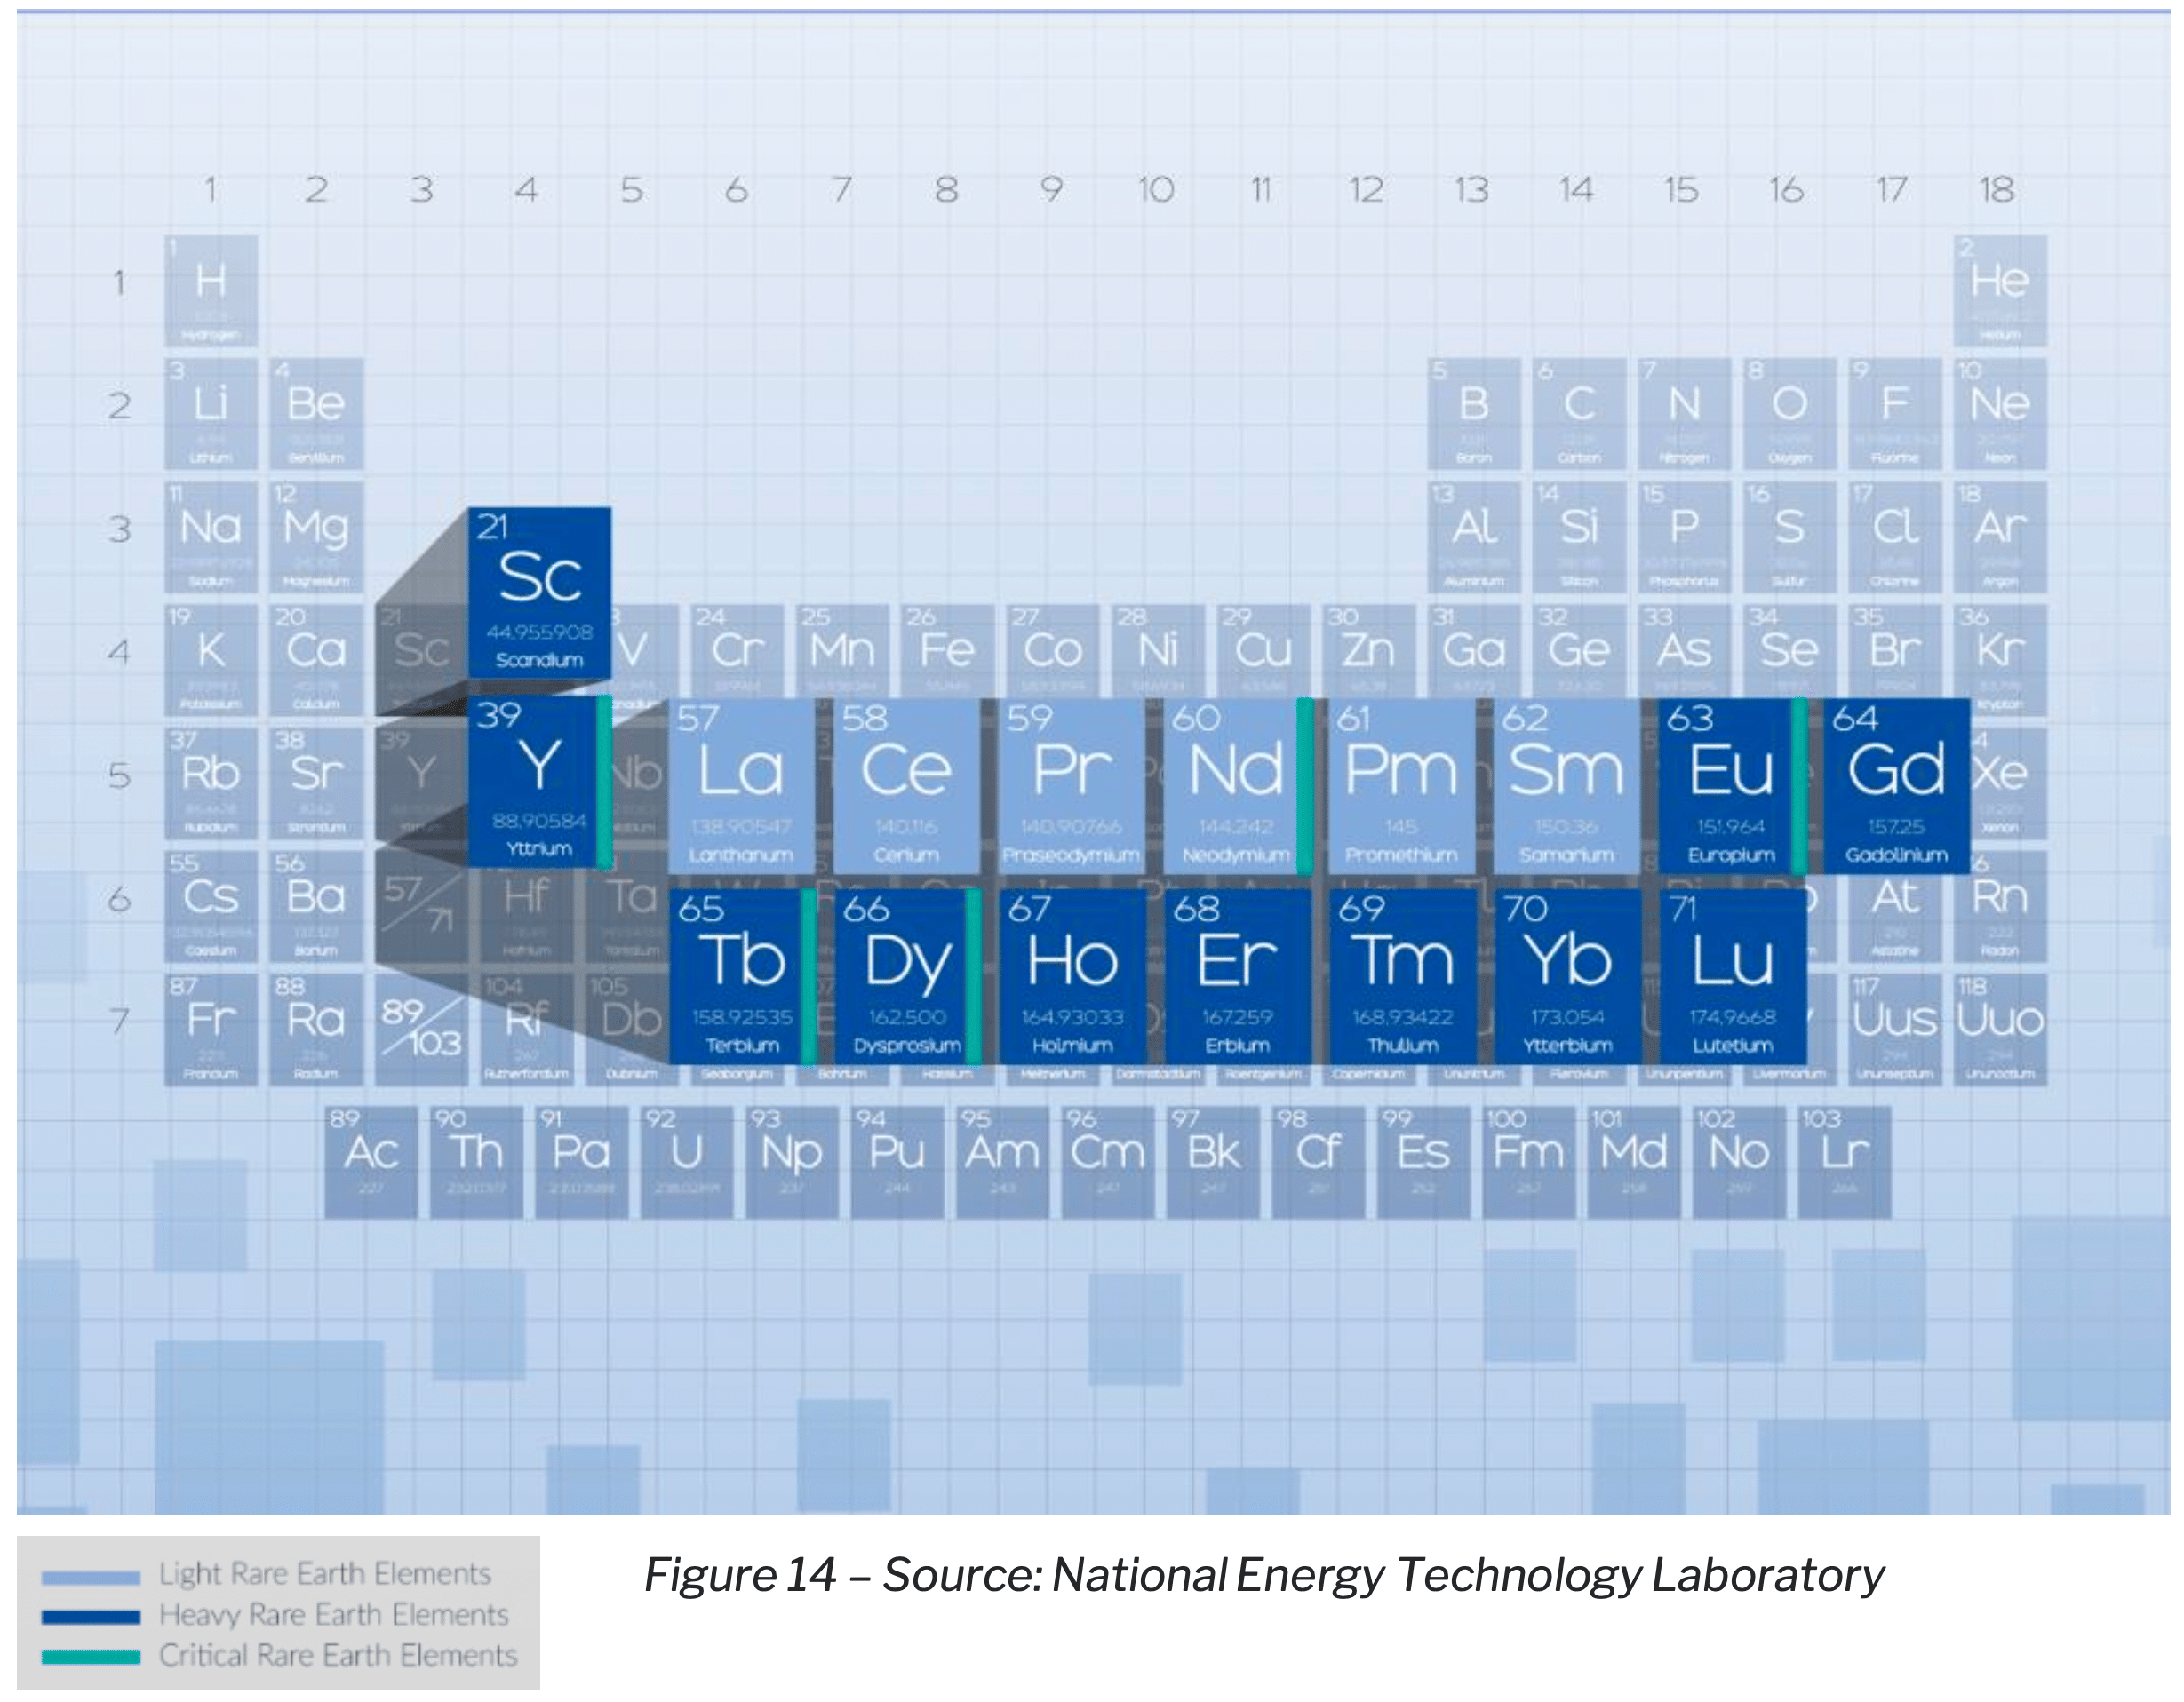
REE refers to a group 17 elements, including the 15 lanthanide elements as well as two additional elements that exhibit similar characteristics, scandium and yttrium. REEs are further divided into Heavy Rare Earth Elements (“HREEs”) and Light Rare Earth Elements (“LREEs”), generally based on their atomic weight. Rare earth deposits will include both LREEs and HREEs. REEs are found primarily in monazite and bastnasite ores, with both typically containing material concentrations of lanthanum (“Le”), Cerium (“Ce”), Praseodymium (“Pr”) and Neodymium (“Nd”).
Additionally, the U.S. Department of Energy identified 5 REEs that it considers to be “Critical Rare Earth Elements” (“CREE”), which include Neodymium, Europium, Terbium, Dysprosium, and Yttrium.
Despite their name, REEs are relatively common in the earth’s crust.
While some key REEs are in short supply, as will be discussed later in this report, others are in oversupply. For example, cerium, neodymium, lanthanum, and yttrium are all more abundant than lithium, lead, helium, silver, or gold. However, economically mineable concentrations of these elements are less common than for many other mineral commodities.
The value of a deposit is highly dependent on the relative concentrations of each REE in the deposit, and less so on the grade of Total Rare Earth Oxide (“TREO”).
Reserves and Production
Worldwide, there are an estimated 120 million tons of REE reserves, with China containing the largest proportion of any country at approximately 37%.
However, China represents approximately 60%7 of global production of REEs in 2021.
Furthermore, China is estimated to account for approximately 78% of REE imports to the United States.8
While there are a range of REE projects in development, many will face significant challenges to achieve production.
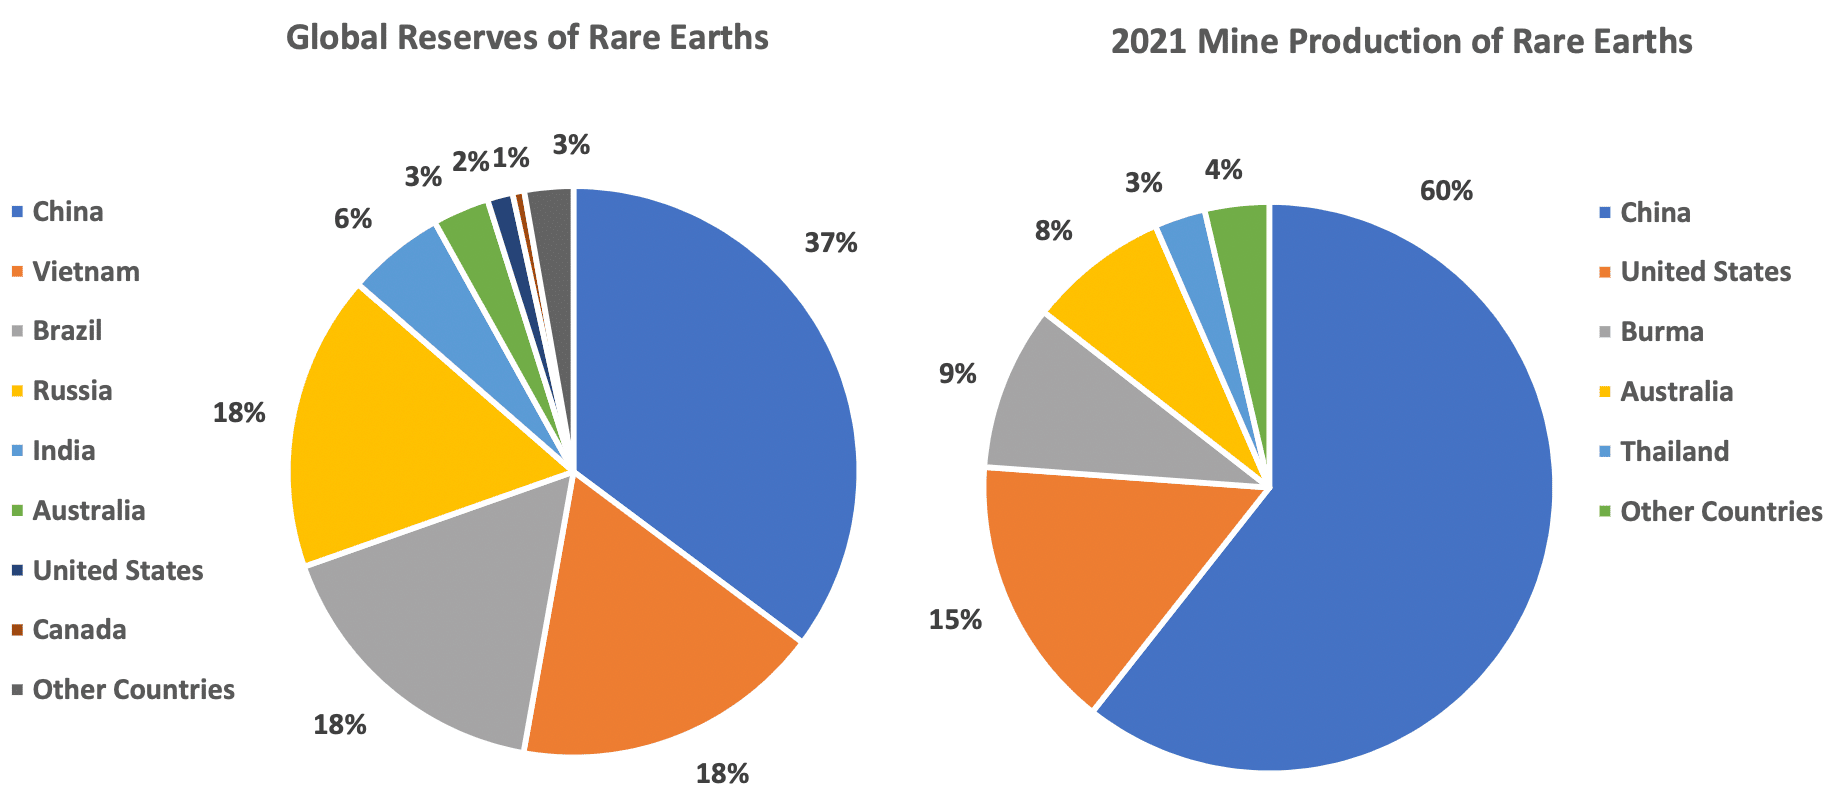
Figure 15 – Source: U.S. Geological Survey, 2022. Total does not add to 100% due to rounding.
Figure 16 – Source: U.S. Geological Survey, 2022. Total may not add to 100% due to rounding.
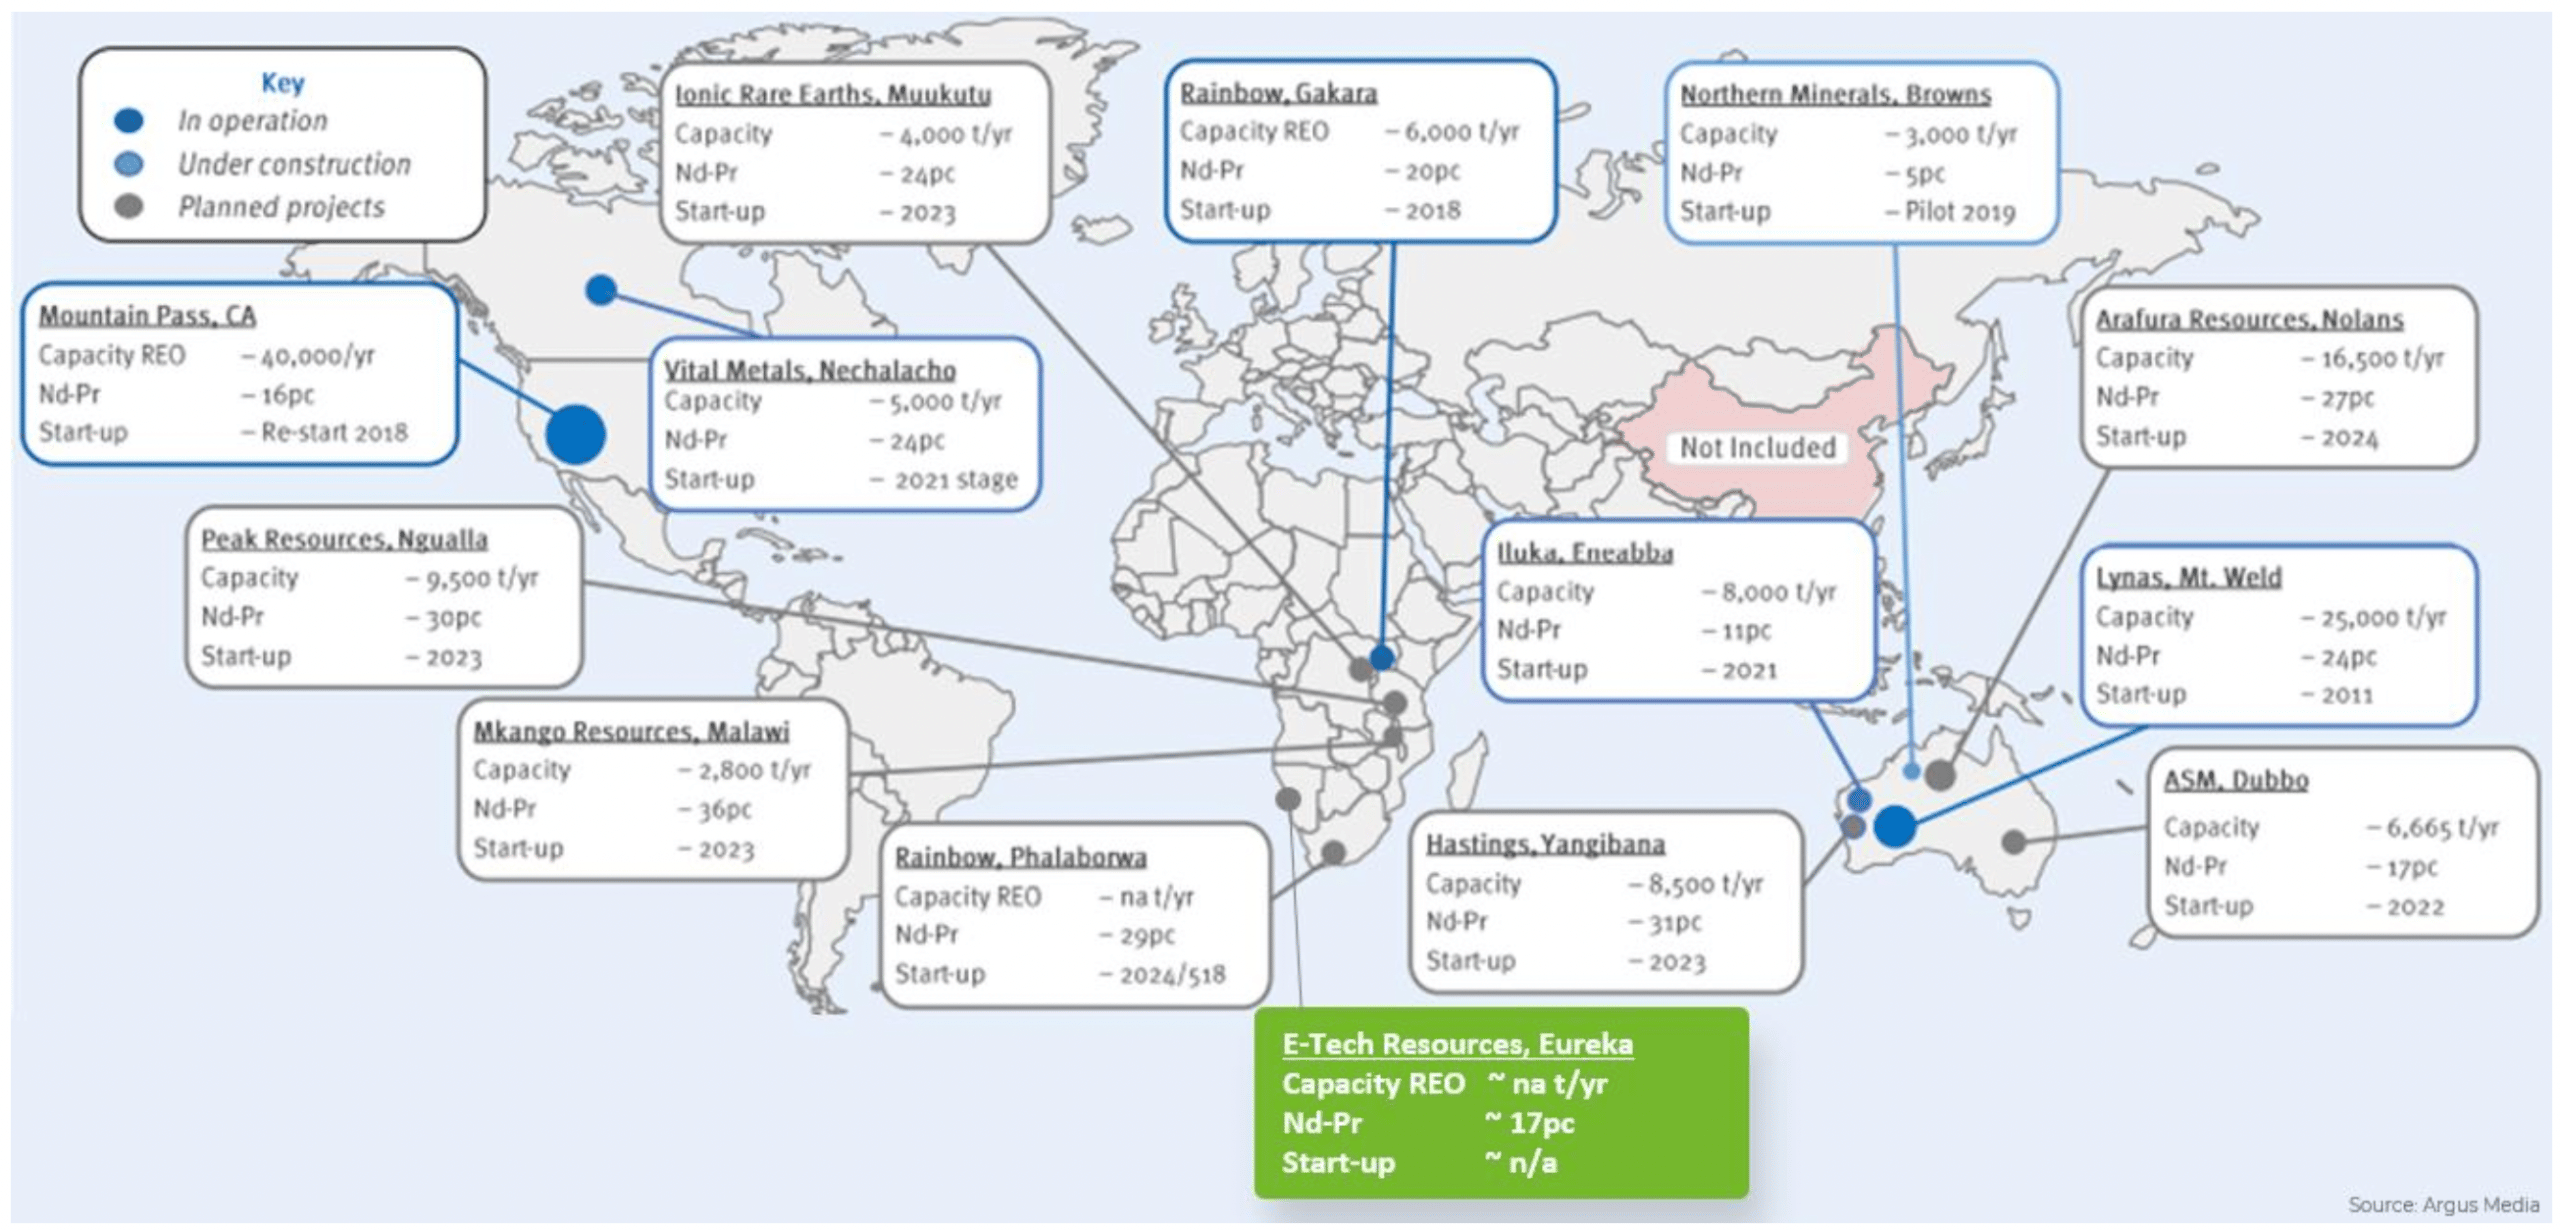
Figure 17 – Source: Company presentation.
China also dominates the separation of REEs, accounting for effectively all the global supply of key REEs like Terbium and Dysprosium.
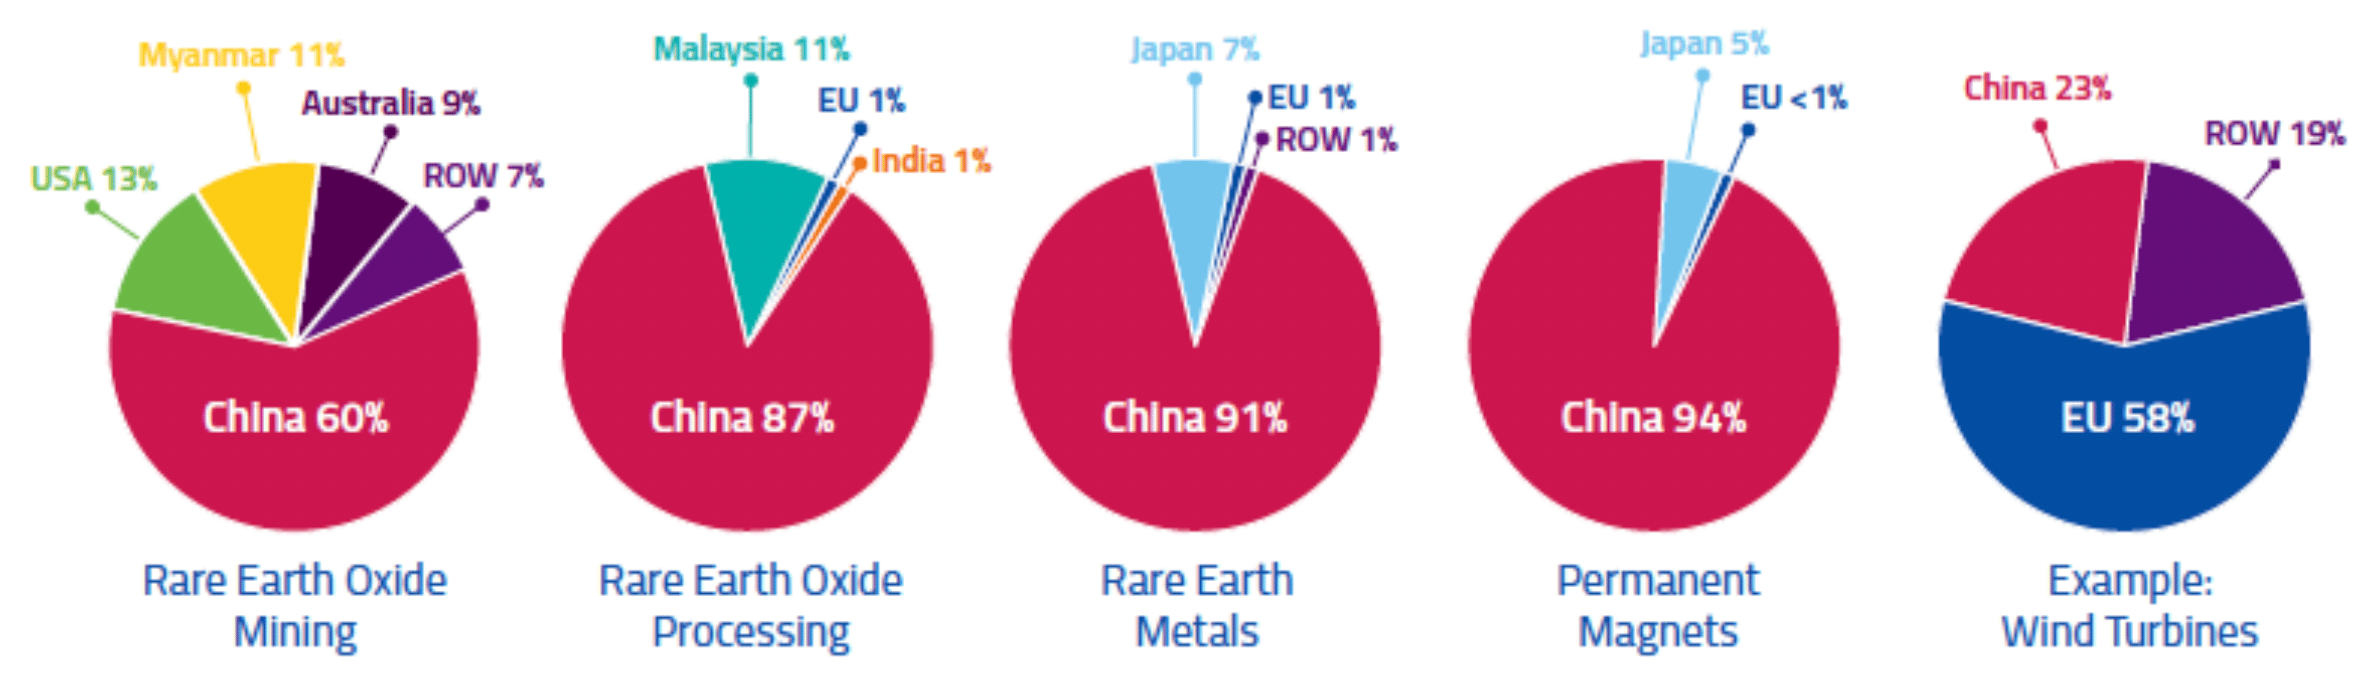
Figure 18 – Source: “Rare Earth Magnets and Motors: A European Call for Action”, Rare Earth Magnets and Motors Cluster of the European Raw Materials Alliance, Berlin 2021.
Volume vs Value
Not all REEs are equal in value. Currently, the most desirable REEs are Neodymium, Praseodymium, Dysprosium, and Terbium. Despite being expected to account for just over 1/3 of the rare earth market by volume in 2030, these 4 REEs are estimated to represent 98% of the market by value in 2030.
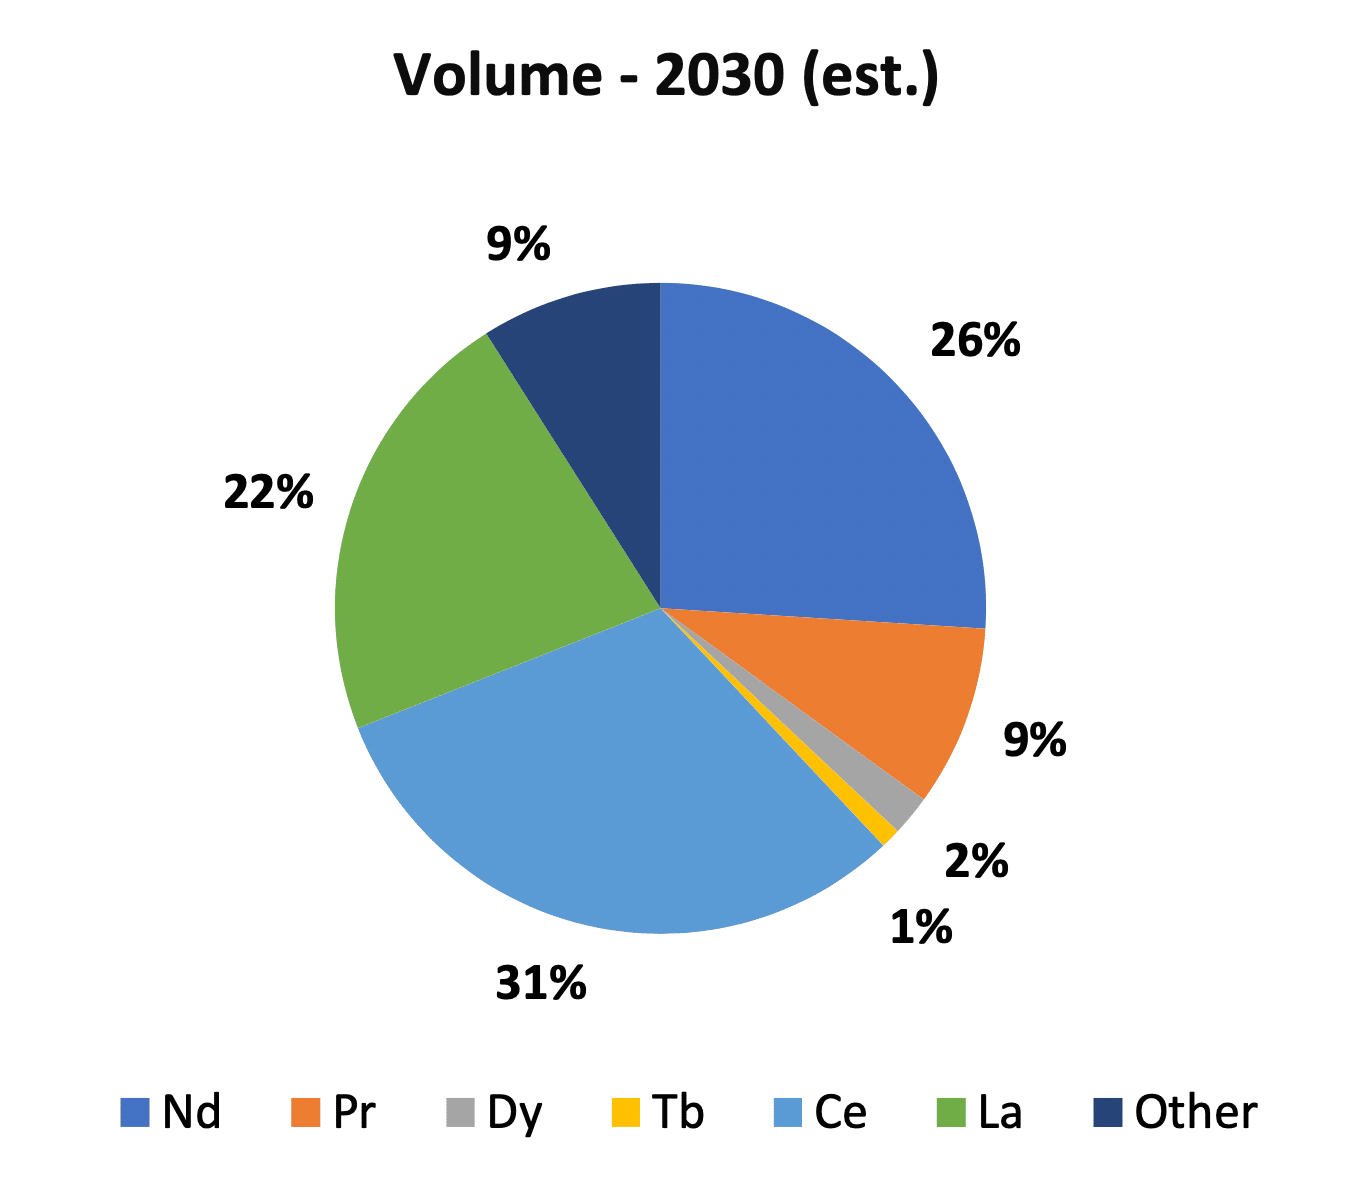
Figure 19 – Source: Company presentation
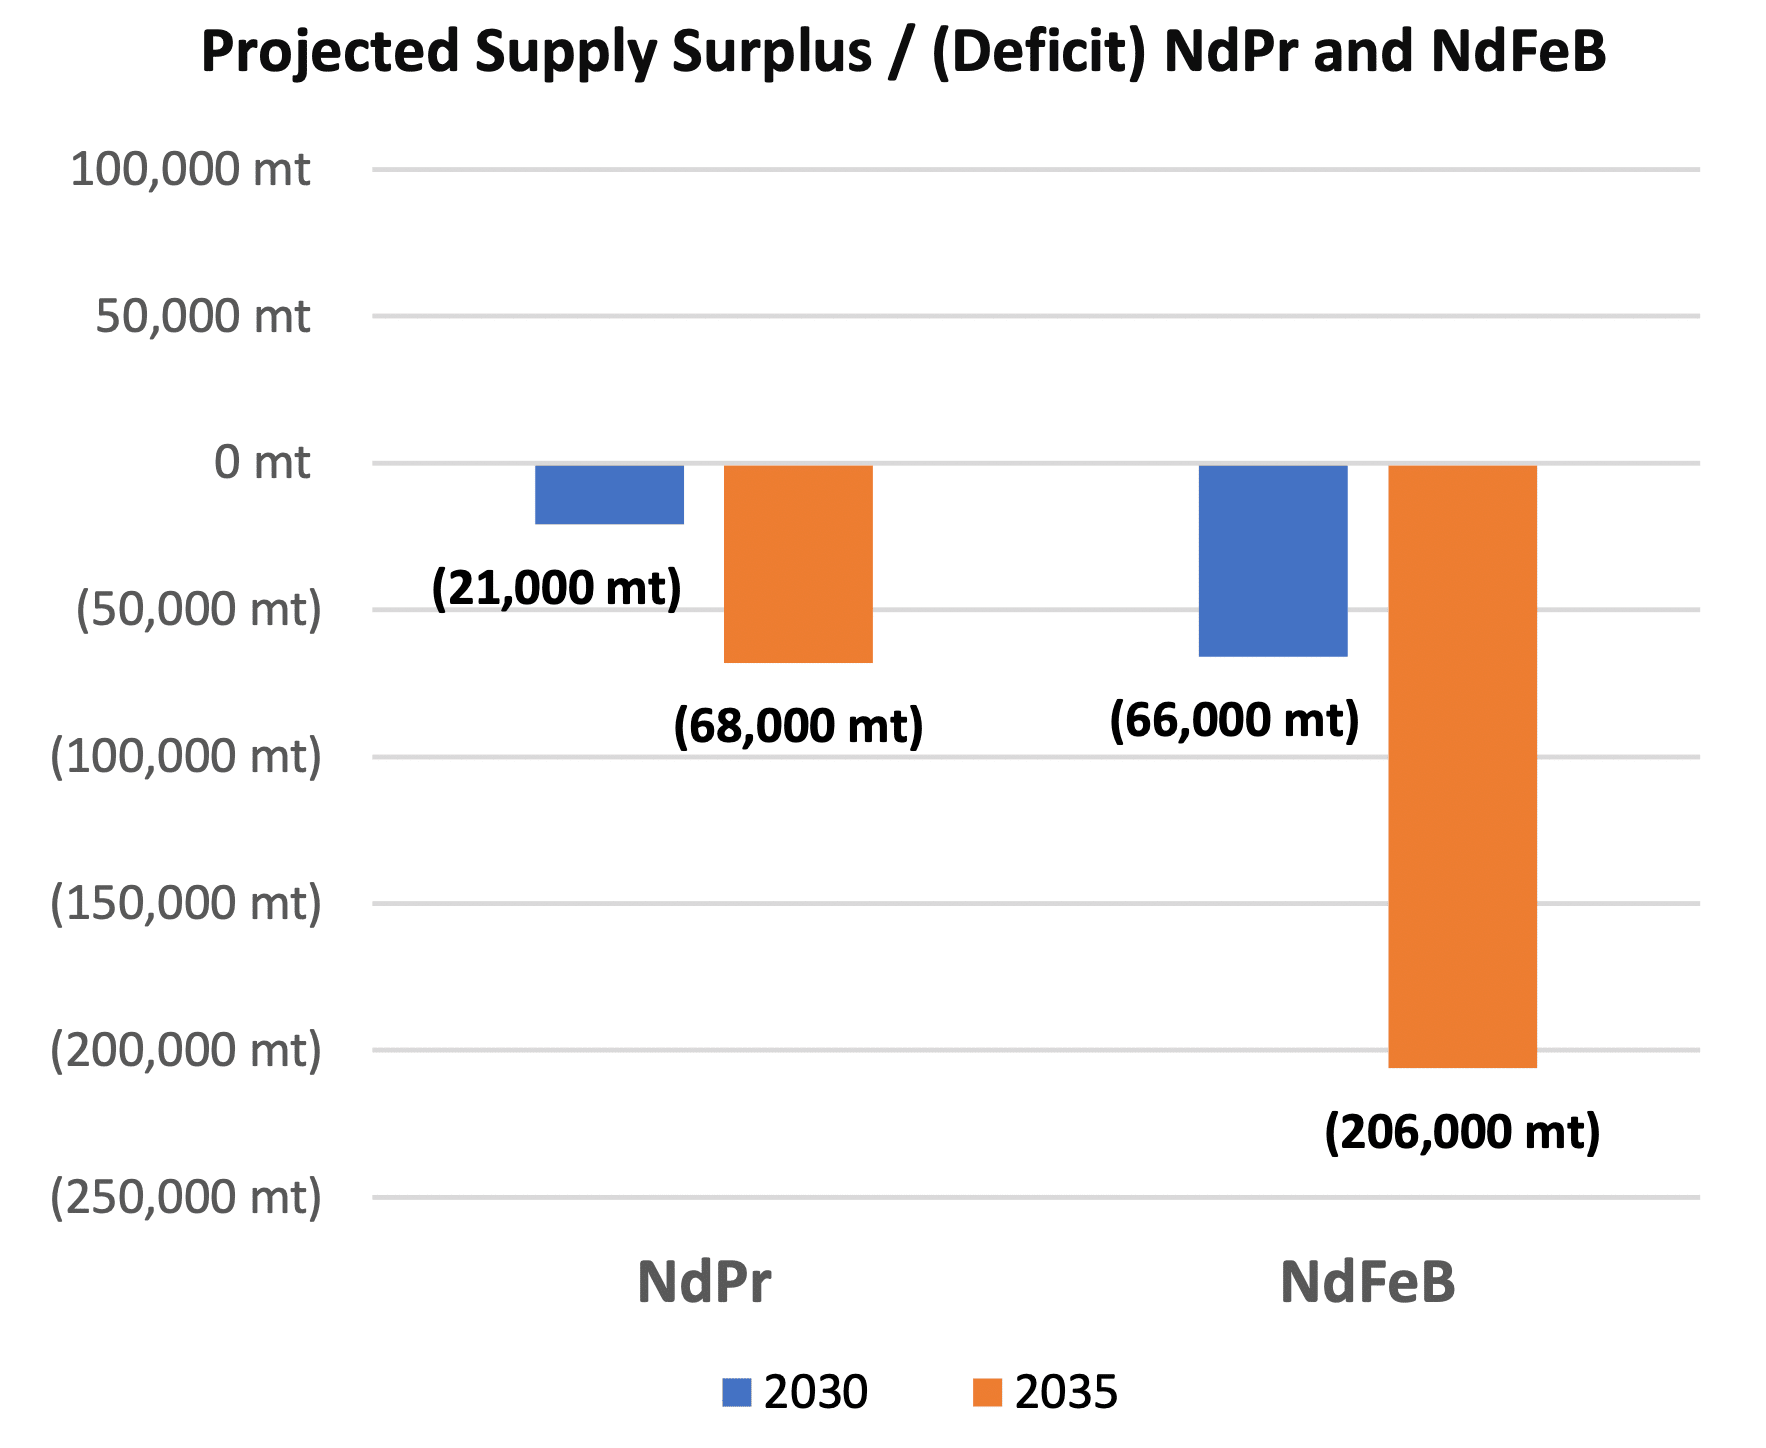
Figure 20 – Source: Adamas Intelligence
Supply and Demand Fundamentals
Demand for REOs, on an annual basis, doubled between 2006 – 2021, to 125,000 mt, and is projected to continue growing to 315,000 mt by 2030.9
For the reasons discussed below, including increased uses and demand for NdPr and Neodymium-Iron-Boron (“NdFeB”) magnets, there are expected to be shortages of key REEs, in particular NdPr.
While surpluses may exist in other, more abundant REEs, such as Ce and La, which are widely regarded as being in an oversupply situation.
Meeting demand for REOs with expected supply deficits will require either increasing capacity at existing operations and/or developing new rare earth mines. Both come with challenges and costs and take time to implement.
Pricing
Driven by supply/demand fundamentals, pricing for in-demand REEs, such as Nd and Pr, have increased significantly over the past 24 months (by 82% and 101%, respectively), despite a recent pull back.
However, prices of more abundant REEs, such as Ce, have been flat to down.
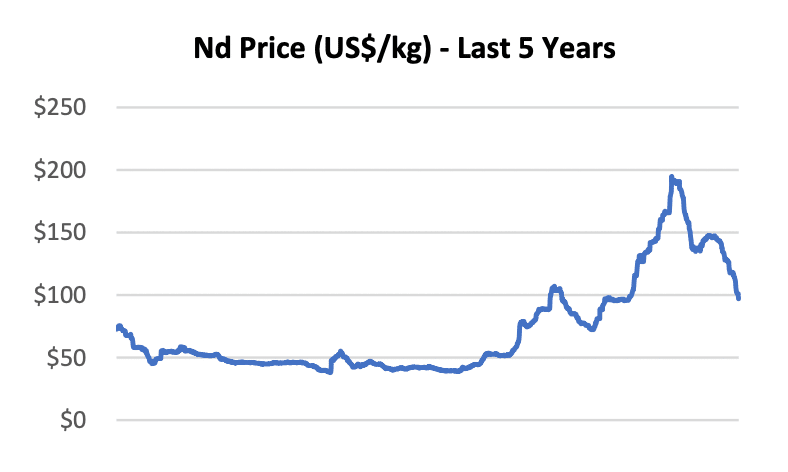
Figure 21 – Source: Bloomberg
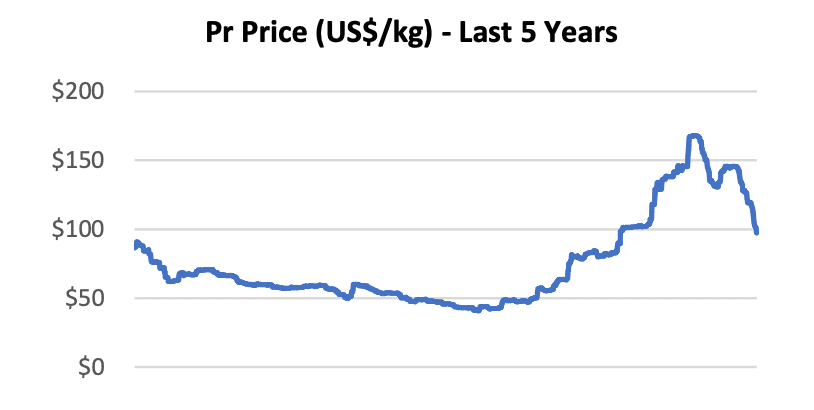
Figure 22 – Source: Bloomberg
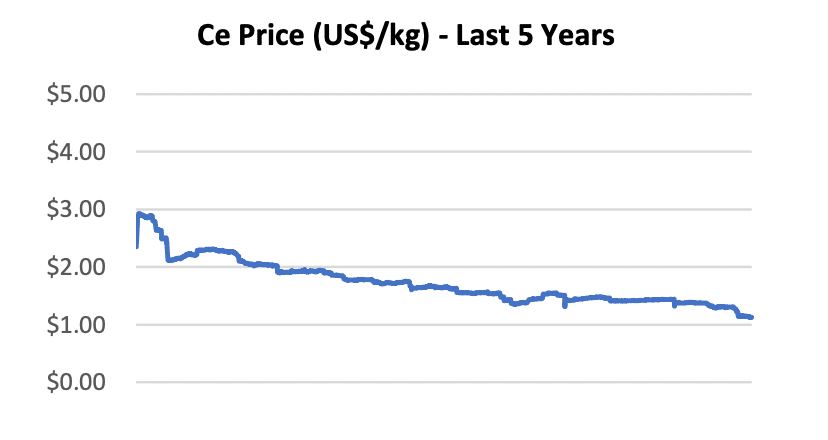
Figure 23 – Source: Bloomberg
Uses of REEs
REEs are used in a wide range of applications.
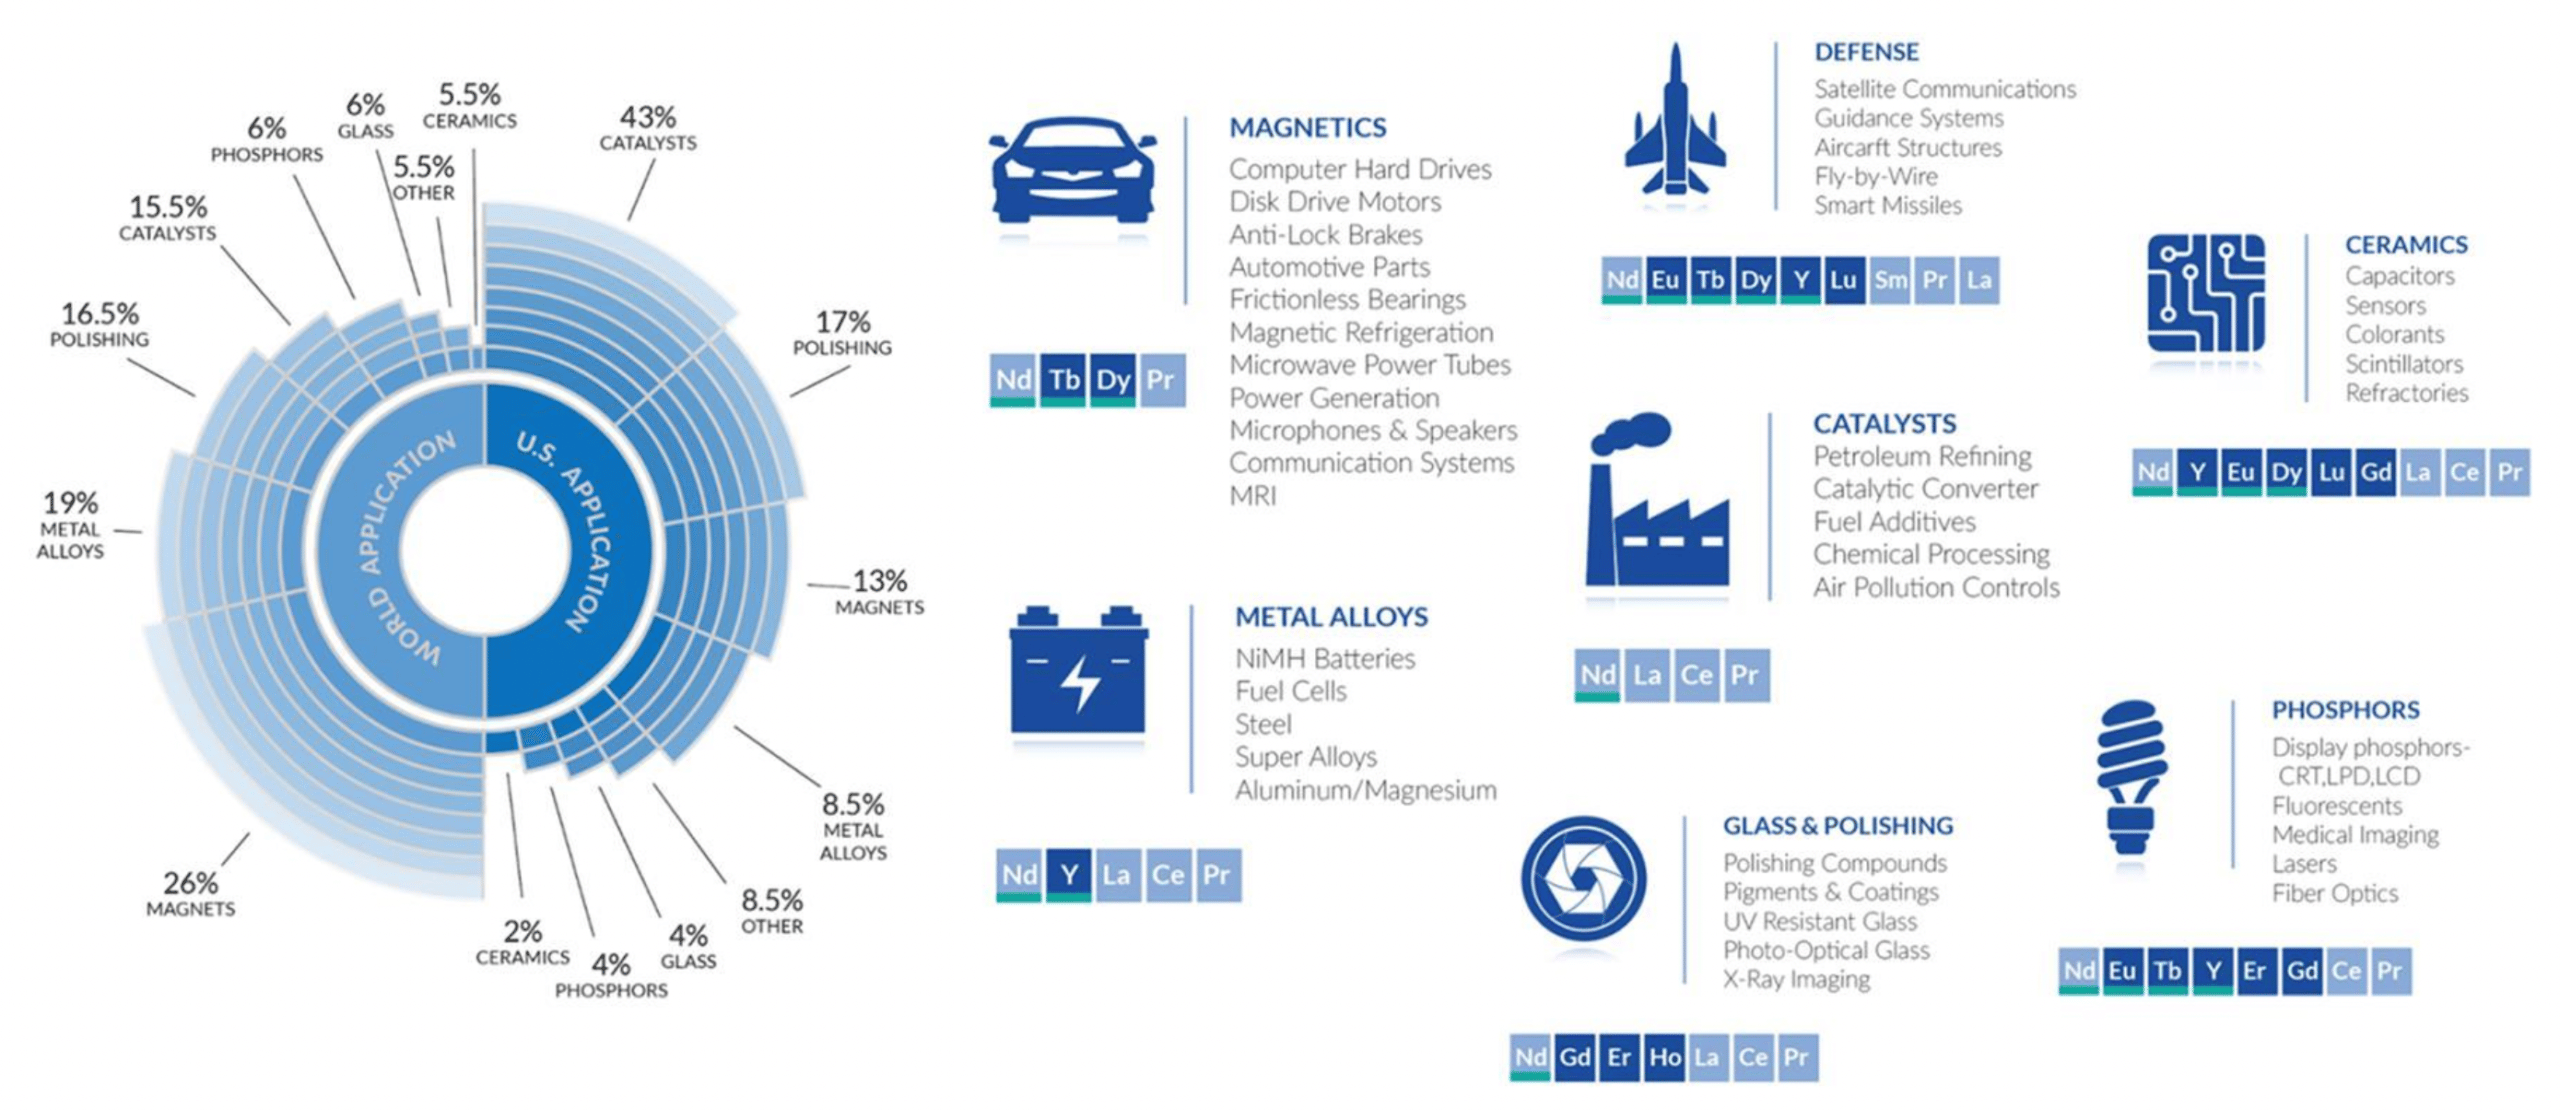
Figure 24 – Source: Congressional Research Service, “An Overview of Rare Earth Elements and Related Issues for Congress” November 24, 2020.
As discussed above, the vast majority of value in the global rare earth market is due to Neodymium/Praseodymium, Terbium, and Dysprosium. This is due to their use in permanent magnets, which are key components in wind turbines and electric vehicle motors.
Permanent magnets are superior to other types of magnets in these applications because they maintain their magnetic properties even in magnetic fields, thereby making them critical components of electrical motors. The most widely used permanent magnet for these applications are Neodymium-Iron- Boron (“NdFeB”) magnets, which contain almost 30% rare earth content by mass.
Dy and Tb can be added to make the magnets stronger and more durable in high temperature environments (such as in an electric motor).
Some estimates predict the combined share of NdPr demand attributable to electric vehicles and wind turbines growing from approximately 24% in 2020 to 59% by 2030 (with electric vehicles accounting for almost 75% of that demand).
The cost of the REE and permanent magnets is significantly less than the resulting benefit. Direct-drive wind turbines, using permanent magnets, offer better yields and lower maintenance costs due to the elimination of a gearbox. This benefit is particularly critical for offshore wind turbines, where maintenance can be difficult.
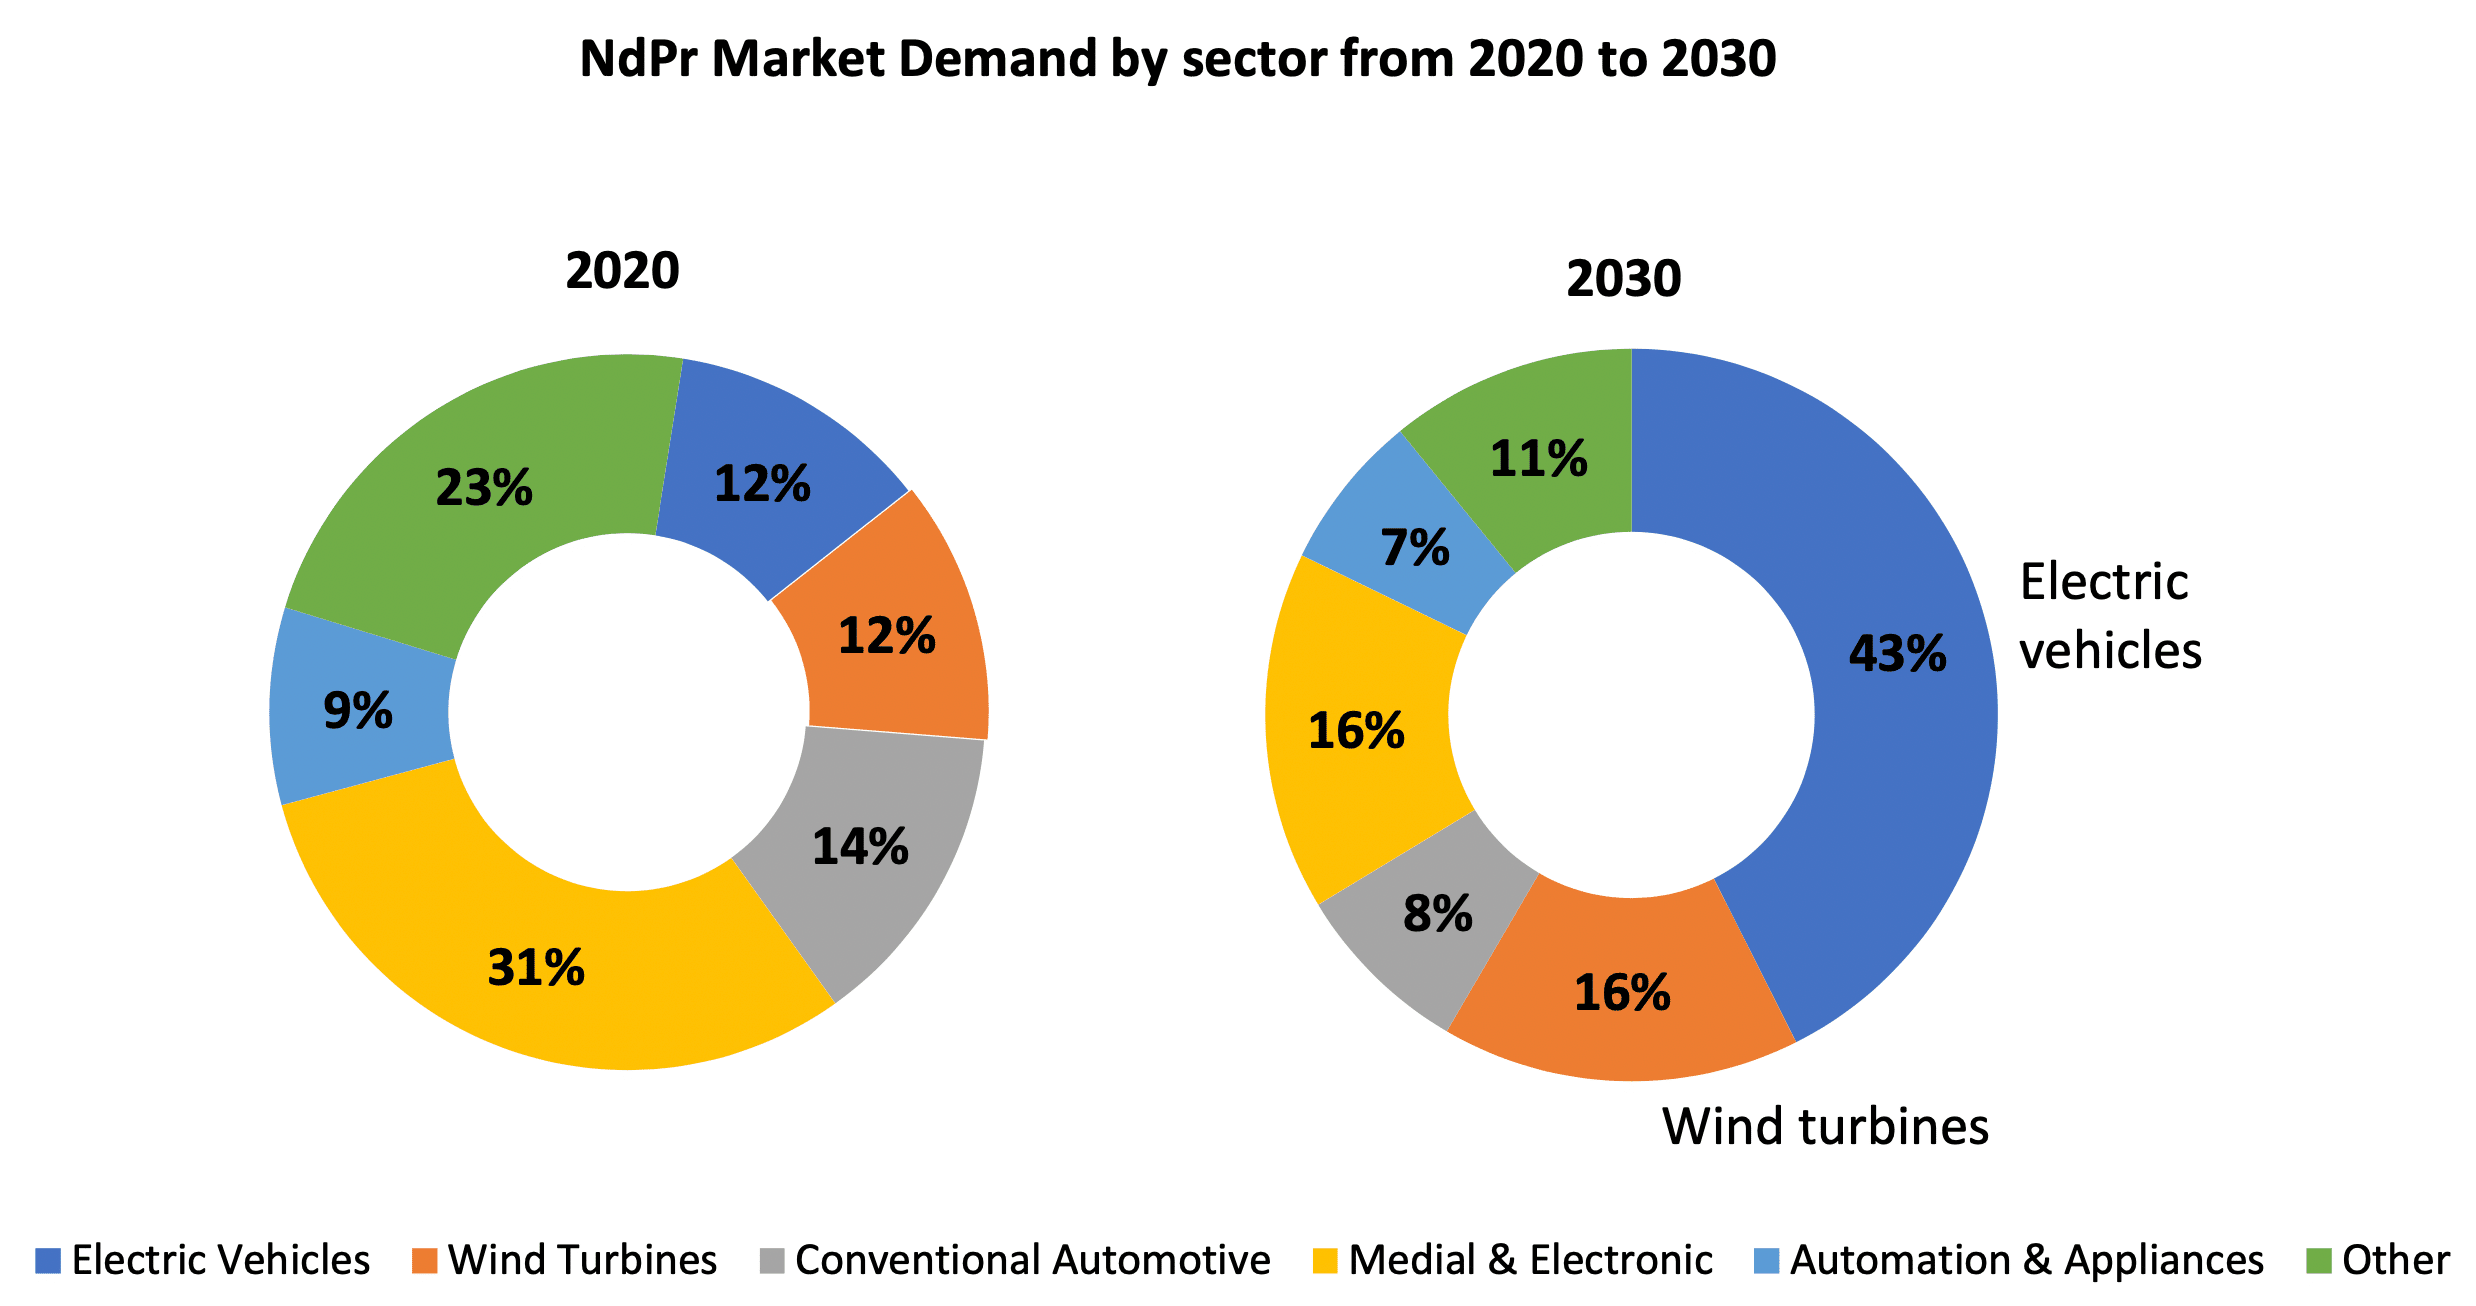
Figure 25 – Source: Industry Research
Electric Vehicles
The average hybrid or electric vehicle uses between 2 – 5kg of rare earth magnets 10, equating to approximately 0.5 – 1.5kg of REEs, with some estimates of total REEs as high as 4.5 kg per hybrid or electric vehicle. This is significantly more than 0.5 – 1.0 kg of REEs estimated for a typical internal combustion engine powered vehicle. The predominant rare earth magnet in these applications is the NdFeB magnet, due to its higher magnet energy property and lower price than previous alternatives.
There were an estimated 16.5 million electric cars globally in 202111, but that number is expected to increase to as many as 200 – 250 million vehicles by 2030, according to estimates by the International Energy Agency (“IEA”).
This growth is largely driven by government policies to reduce overall emissions, as well as rising fuel prices and increasing consumer awareness of climate change driving shifts to “greener” alternatives. Regulatory targets set in the European Union and United States aim for an EV share of at least 50% by 2030, and there is talk of potential bans on internal combustion engines (“ICE”s).12
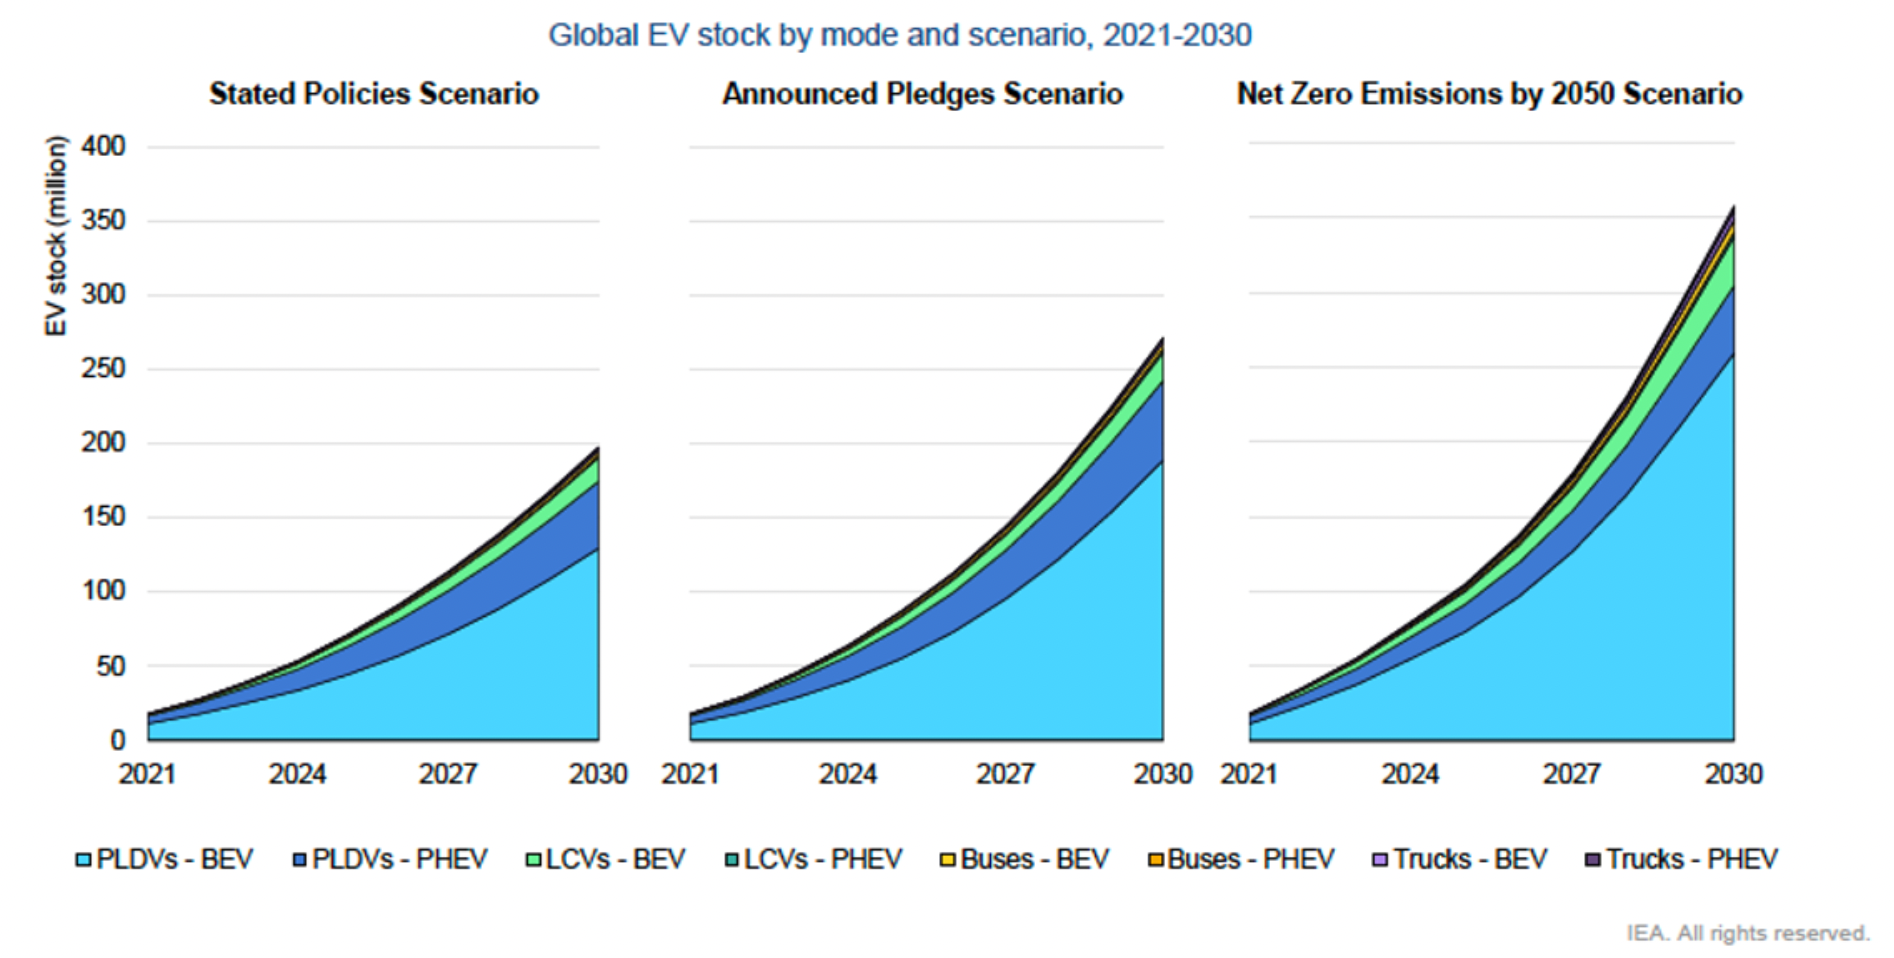
Figure 26 – Source: IEA, “Global EV Outlook 2022”. Demonstrates EV stock, based on relevant governmental policies.
Even more conservative estimates of 70 million EVs13 on the road by 2030 still indicate a significant annual increase from current levels and resulting demand for REEs and rare earth magnets.
Substitution risk
There is potential for other materials to be used in place of rare earth elements in a given product or application. In the case of electric vehicles, the move to induction motors may lead to a reduction in the use of rare earths, as these motors do not require the use of rare earth magnets in their construction. This could potentially reduce the demand for rare earths and create substitution risk for these materials.
Wind Turbines
A secondary growth driver for NdPr and permanent magnets is wind turbines. Global wind power capacity is expected to grow at a CAGR of 9% between 2021 and 2030,14 reaching a projected capacity of almost 1.8 terawatts (“TW”).
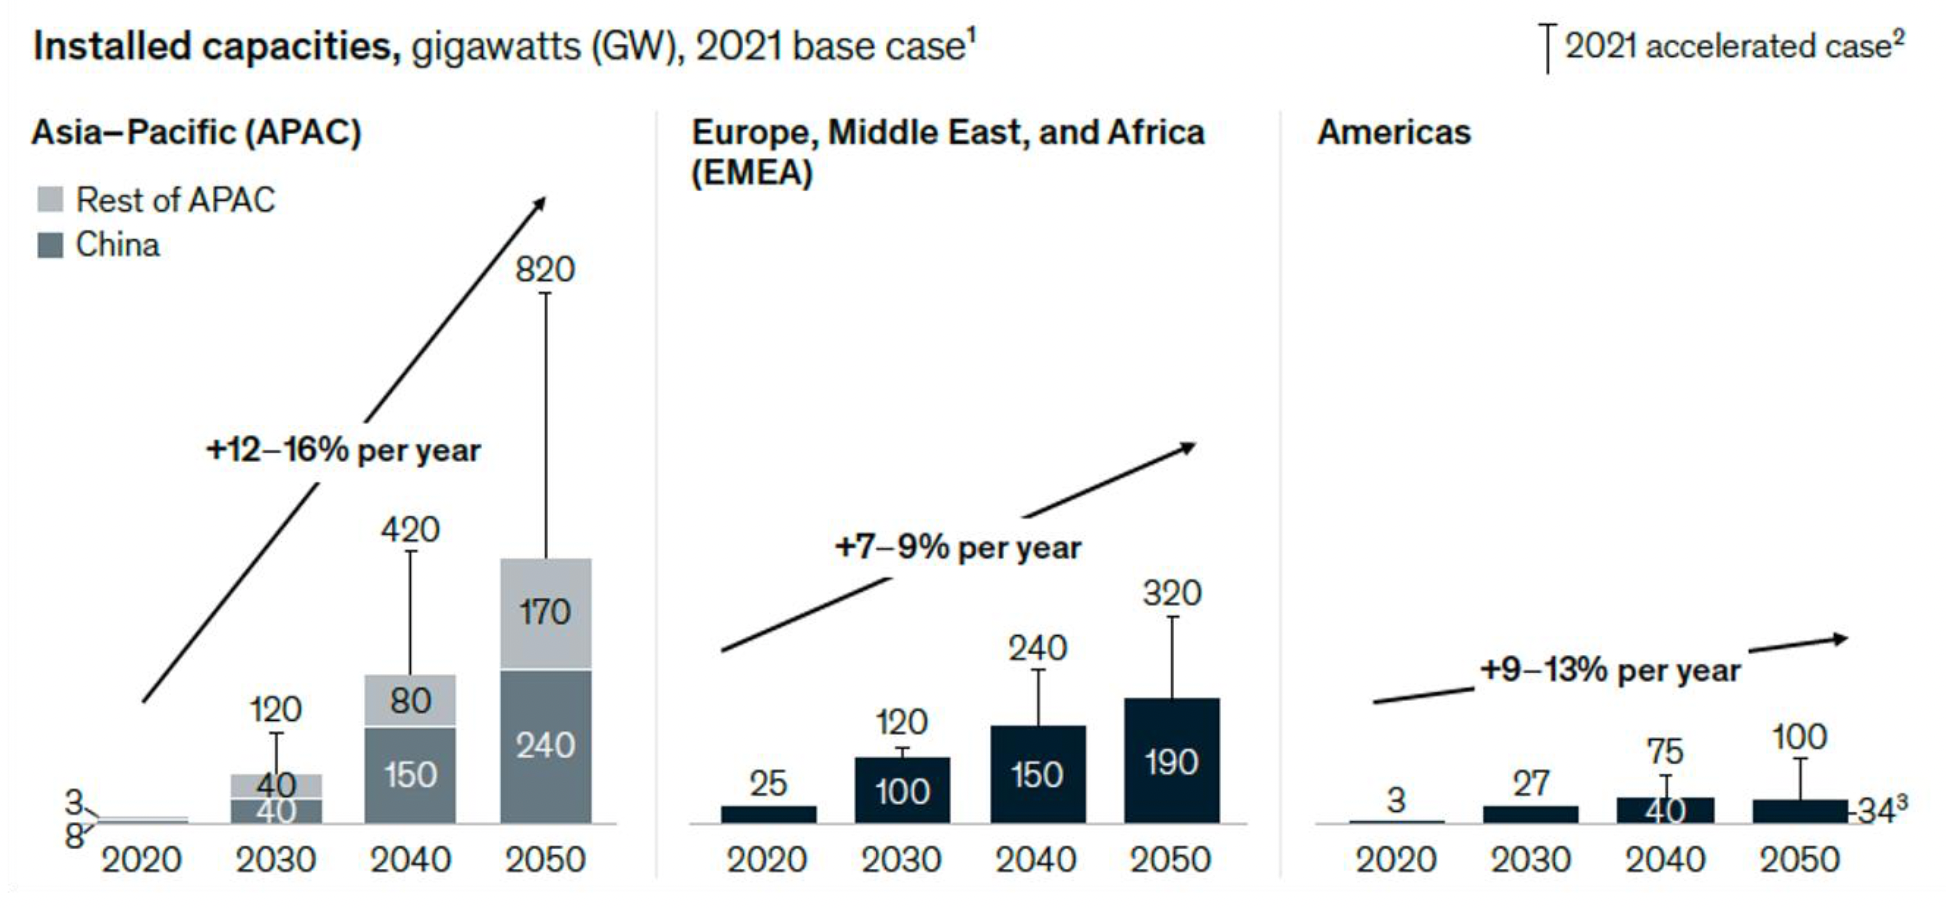
Figure 27 – Source: McKinsey, “How to Succeed in the Expanding Global Offshore Wind Market”, April 20, 2022.
Offshore wind capacity, as a subset of total wind capacity, is estimated to grow from approximately 40 gigawatts (“GW”) in 2020 to 200 – 270 GW by 2030,15 implying a CAGR of approximately 20% over that period, and up to 630GW by 2050 with further upside potential to as much as 1,000 GW.
Direct drive turbines are estimated to require 650kg of permanent magnets per MW (which, assuming 30% REEs in each magnet, equates to approximately 200kg REE per MW). This is approximately 4 – 8x the mass of permanent magnets required for a geared turbine.
Defence Applications
REEs are also used in many defense applications, including motors in critical equipment, guidance systems, and radar and sonar applications. For example, a single F35 fighter jet requires over 400kg of rare earth materials, while a Virginia-class submarine requires more than 4,000kg.16 The U.S. government aims to reduce its reliance on Chinese REEs by diversifying its sources of critical minerals.
Influence of China
China has dominated the REE industry since the 1980’s. Prior to that, since the 1960s, the U.S. was the world’s largest producer of REEs. By the 2010s, China produced 85% of global REEs and supplied 95% of processed REEs. Currently, 37% of global REE reserves are in China, however China represents 60% of global REE mine production (as of 2021).
China’s market dominance has led to a period of pricing and supply uncertainty. Quotas exist, set by the Chinese government, controlling rare earth production in and exports from China.
A significant reduction in those quotas in 2010, 25% for production of REOs and 37% for export of various RE products, resulted in significant price increases in 2010 – 2011.17
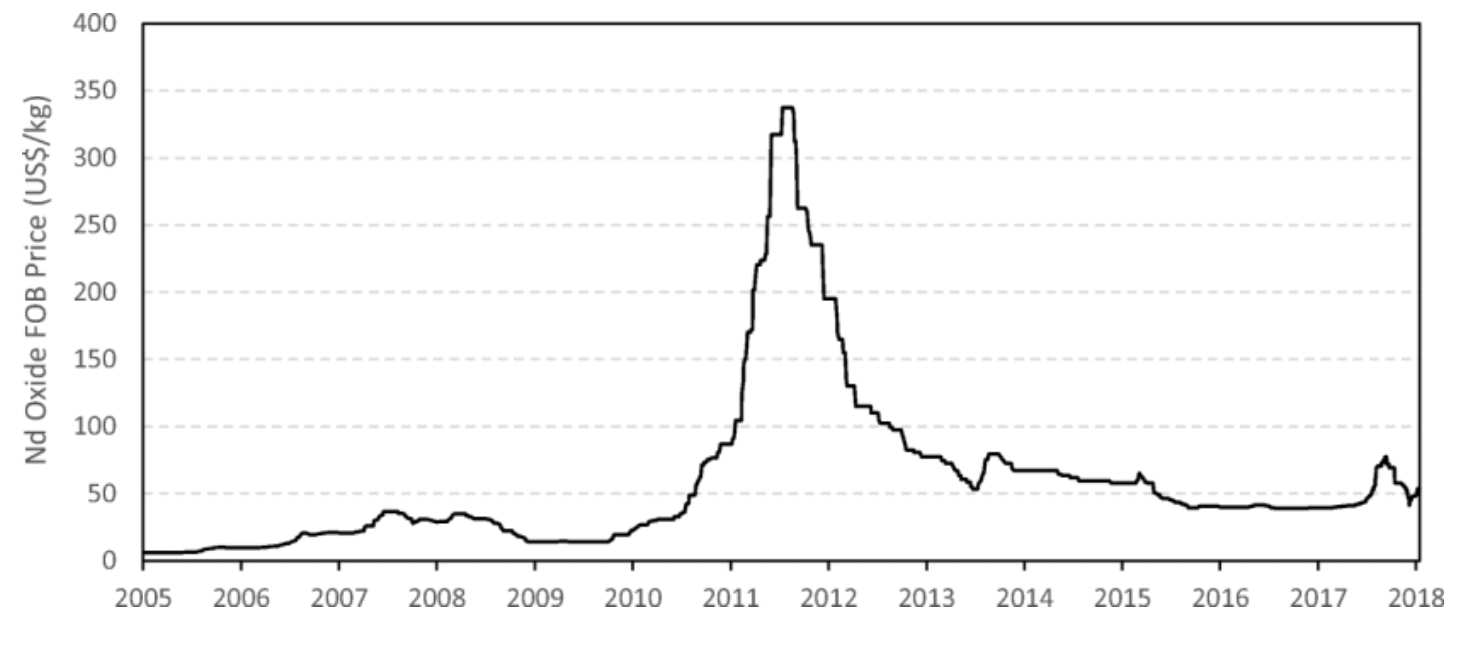
Figure 28 – Chinese Neodymium Oxide Export Price: Source: Argus Media.
Quotas have since increased but remain a significant supply concern.
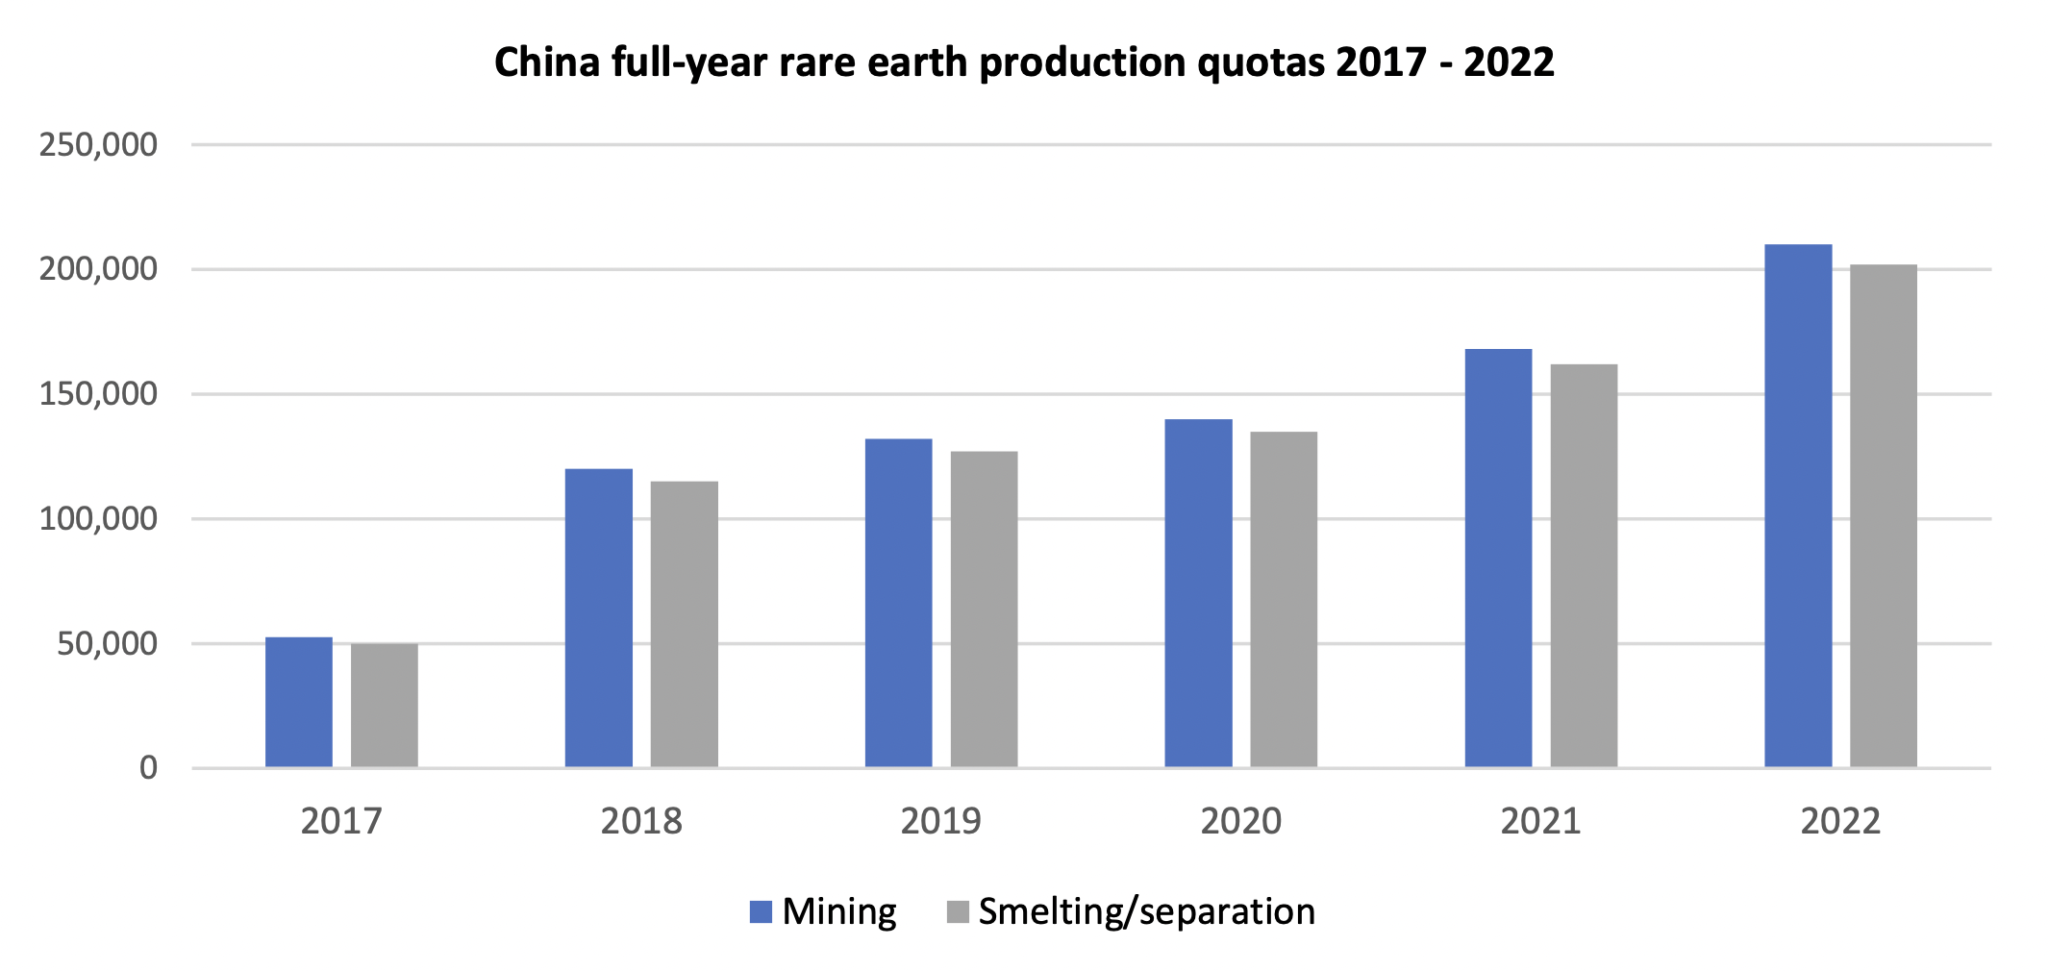
Figure 29 – Source: MIIT, Ministry of Natural Resources
Quotas for H1-2022 were increased by 20%, relative to H1-2021, for both rare earth mining and processing. Mining quotas increased from 84,000 tons to 100,800 tons and smelting and separation quotas increased from 81,000 tons to 97,200 tons.18
As a result of the price volatility of REEs, and general recognition of the importance of access to critical REEs ex-China, many countries have indicated a desire to develop additional or domestic sources for critical elements. As a result, China is working to maintain their control of the market through purchase agreements, control over REE processing and separation, and manufacture of downstream products.19
Major Players in the REE Mining Industry
The major players in the Chinese rare earths mining and processing markets have been China Northern Rare Earth, China Southern Rare Earth (a subsidiary of Ganzhou Rare Earth Group), Chinalco Rare Earth & Metals Company (a subsidiary of Aluminum Corporation of China or Chinalco), Xiamen Tungsten, Guangdong Rare Earth Industry Group, and China Minmetals Corporation.
In late 2021, it was announced that the Chinese rare earth industry would consolidate, with Chinalco Rare Earth & Metals Co, Minmetals Rare Earth (a subsidiary of China Minmetals), and China Southern Rare Earth Group, as well as two research companies, combining into the newly established China Rare Earth Group Co. Ltd.20 Ownership of the new entity is 31.21% to the State-owned Assets Supervision and Administration Commission (the national asset regulator) 20.33% to each of Aluminum Corporation of China, China Minmetals, and Ganzhou Rare Earth Group, with the remainder split between the two research companies, China Iron & Steel Research Institute Group and Grinm Group Corporation Ltd. 21
Outside of China, there are a wide range of planned projects, but few current producers.
The two largest producers outside of China are Lynas and MP Materials.
Lynas
Lynas operates the Mount Weld rare earth mine in Western Australia. Rare earth concentrates are processed at Lynas’ plant in Malaysia, which is the world’s largest single rare earths processing plant. Lynas is currently constructing an additional rare earths processing facility in Kalgoorlie, Australia and proposing an additional processing facility in the United States.
The Mt Weld deposit reported total ore reserves of 18.9 million tonnes at a TREO grade of 8.3%.
In their FY2022, Lynas produced 15,970 tonnes of REO including 5,880 tonnes of NdPr.22
MP Materials
MP Materials owns and operates the Mountain Pass rare earths mine in California. The Mountain Pass mine has been in production off and on since 1952. MP Materials has a stated goal of restoring the “full rare earth supply chain to the United States”.
Over the last 12 months (through June 2022), MP Materials produced 43,387 metric tons of REO in concentrate. By the end of 2023, they expect to achieve a run-rate annual production of 20,000 metric tons of refined TREO, including ~6,075 metric tons of NdPr.23
In 2022, MP Materials plans to start processing rare earths at its own facility, whereas it previously shipped rare earth concentrate to China for processing. Once their facility upgrades are complete, MP Materials will be able to produce separated REOs from its concentrate. Longer-term plans include expanding downstream into magnet production.
In their September 2021 technical report, Mountain Pass was reported to have ore reserves of 30.45m st (short tons) at a TREO grade of 6.36%.24